

Mathematics, 21.12.2019 10:31, JeroMii
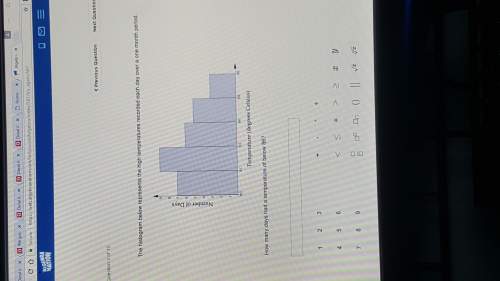
The histogram below represents the high temperatures recorded each day over a one month period.
how many days had a temperature of below 86?

Answers: 2


Other questions on the subject: Mathematics
Mathematics, 21.06.2019 15:30, priscymtz27
Which is the completely factored from of xy^3-x^3y
Answers: 3
Mathematics, 21.06.2019 18:40, haidenmoore92
Which of the following would be a good name for the function that takes the weight of a box and returns the energy needed to lift it?
Answers: 1
Mathematics, 21.06.2019 19:30, sb6998
Michelle and julie work at a catering company. they need to bake 264 cookies for a birthday party that starts in a little over an hour and a half. each tube of cookie dough claims to make 36 cookies, but michelle eats about 1/5 of every tube and julie makes cookies that are 1.5 times as large as the recommended cookie size. it takes about 8 minutes to bake a container of cookies, but since julie's cookies are larger, they take 12 minutes to bake. a. how many tubes should each girl plan to bake? how long does each girl use the oven? b. explain your solution process what did you make? c. what assumptions did you make?
Answers: 1
Mathematics, 22.06.2019 02:00, dawood7068
Which is the best estimate of the product of 0.9 x 0.88? 0 0.25 0.5 1
Answers: 2
Do you know the correct answer?
The histogram below represents the high temperatures recorded each day over a one month period.
Questions in other subjects:
Mathematics, 05.05.2020 19:44


Biology, 05.05.2020 19:44
Mathematics, 05.05.2020 19:44

English, 05.05.2020 19:44


