

Mathematics, 03.11.2019 23:31, deena7
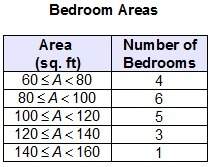
The students in marly’s math class recorded the dimensions of their bedrooms in a frequency table.
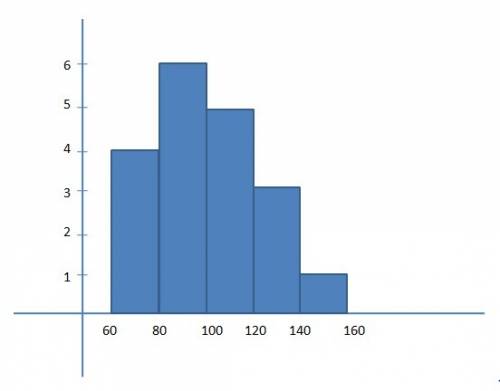
create a histogram to represent the data. which statement is most likely true about the mean and the median of the data?
a) the histogram is right-skewed, so the mean is less than the median.
b) the histogram is right-skewed, so the mean is greater than the median.
c) the histogram is left-skewed, so the mean is less than the median
d) the histogram is left-skewed, so the mean is greater than the median

Answers: 1


Other questions on the subject: Mathematics
Mathematics, 21.06.2019 19:30, ramose7021
Show your workcan a right triangle have this sides? *how to prove it without using the pythagorean theorema*
Answers: 2
Mathematics, 21.06.2019 21:30, BARRION1981
Over the course of the school year, you keep track of how much snow falls on a given day and whether it was a snow day. your data indicates that of twenty-one days with less than three inches of snow, five were snow days, while of the eight days with more than three inches of snow, six were snow days. if all you know about a day is that it is snowing, what is the probability that it will be a snow day?
Answers: 1
Mathematics, 21.06.2019 23:30, Bryanguzman2004
Which two fractions are equivalent to 24/84? 6/42 and 2/7 6/21 and 2/6 12/42 and 3/7 12/42 and 2/7
Answers: 1
Mathematics, 22.06.2019 02:00, Isabellawuzhere
The price of a lawn mower is x dollars. the store is having a 75% end of summer clearance sale. which expression can be used to find the clearance price of the mower? a) .25x b) .75x c) x - .25(75) d) x + .25(75)
Answers: 3
Do you know the correct answer?
The students in marly’s math class recorded the dimensions of their bedrooms in a frequency table.
Questions in other subjects:


Business, 05.05.2020 07:40
Mathematics, 05.05.2020 07:40
English, 05.05.2020 07:40
Mathematics, 05.05.2020 07:40


History, 05.05.2020 07:40


