

Mathematics, 31.10.2019 05:31, jia699
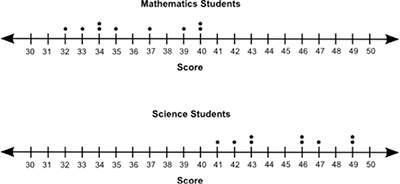
The dot plots below show the test scores of some mathematics students and some science students:
based on visual inspection of the dot plots, which group of students appears to have the larger average score?
the mathematics students
the science students
both groups are similar.
not enough information is available to draw a conclusion.

Answers: 1


Other questions on the subject: Mathematics
Mathematics, 21.06.2019 23:30, honwismun1127
Which statements are true about box plots? check all that apply. they describe sets of data. they include the mean. they show the data split into four parts. they show outliers through really short “whiskers.” each section of a box plot represents 25% of the data.
Answers: 3
Mathematics, 21.06.2019 23:50, stricklandashley43
Quick graph the line for y+2=32(x+4) on the coordinate plane. does anyone know the cordinates will mark brainliest.
Answers: 1
Do you know the correct answer?
The dot plots below show the test scores of some mathematics students and some science students:
Questions in other subjects:
Mathematics, 03.05.2021 16:10
Mathematics, 03.05.2021 16:10


Biology, 03.05.2021 16:10
Mathematics, 03.05.2021 16:10

Mathematics, 03.05.2021 16:10
English, 03.05.2021 16:10


