


A.
the data in the table represents the average number of daylight hours each month in springf...

Mathematics, 12.10.2019 11:20, heiddy0122
A.
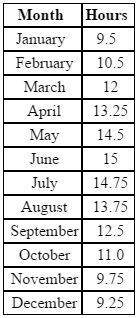
the data in the table represents the average number of daylight hours each month in springfield in 2015, rounded to the nearest quarter-hour. write an equation that models the data.
b.
what is the expected number of daylight hours in march 2020? explain how you found this.

Answers: 3
Other questions on the subject: Mathematics
Mathematics, 21.06.2019 16:30, catdog2230
Determine whether the quadrilateral below is a parallelogram. justify/explain your answer (this means back it up! give specific information that supports your decision. writing just "yes" or "no" will result in no credit.)
Answers: 2
Mathematics, 21.06.2019 18:30, amorosoavap5cejz
You receive 15% of the profit from a car wash how much money do you receive from a profit of 300
Answers: 2
Mathematics, 21.06.2019 19:40, sswd
The owners of four companies competing for a contract are shown in the table below. if a report is released that advocates company b, which of the people having funded the report should result in the most skepticism? company owner of company company a jake adams company b company c company d debby smith henry rose rhonda baker o a. jake adams o b. rhonda baker o c. debby smith o d. henry rose
Answers: 2
Do you know the correct answer?
Questions in other subjects:

English, 16.11.2020 08:00
Mathematics, 16.11.2020 08:00


Mathematics, 16.11.2020 08:00
Mathematics, 16.11.2020 08:00
English, 16.11.2020 08:00


