


use the graph of methods of transportation to a city park to answer the question.

Mathematics, 28.12.2019 09:31, tburlew01
3.
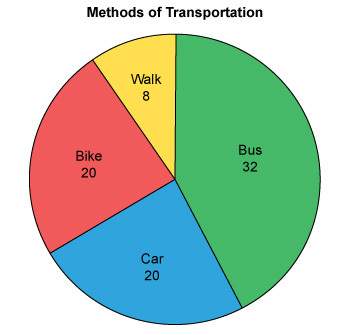
use the graph of methods of transportation to a city park to answer the question.
what percent of people took the bus to the city park?
a.
20%
b.
25%
c.
32%
d.
40%
4.
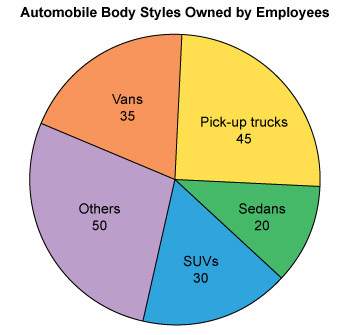
use the graph of automobile styles owned by employees of a certain company to answer the question.
what is the ratio of suv or pick-up truck owners to owners of vans?
a.
7: 15
b.
1: 2
c.
2: 1
d.
15: 7
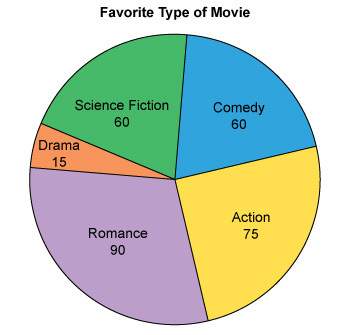
use the graph of favorite types of movies to answer the question.
what is the ratio of the number of people who prefer science fiction to the number who prefer action?
a.
4: 9
b.
4: 5
c.
5: 4
d.
9: 4
use the graph of favorite types of movies to solve.
what is the ratio of the number of people surveyed to the number who prefer action movies?
a.
b.
c.
d.

Answers: 2
Other questions on the subject: Mathematics
Mathematics, 21.06.2019 18:50, millernicholas622
The random variable x represents the number of phone calls an author receives in a day, and it has a poisson distribution with a mean of 8.7 calls. what are the possible values of x
Answers: 1
Mathematics, 21.06.2019 21:00, jonquil201
These box plots show the number of electoral votes one by democratic and republican presidential candidates for the elections from 1984 through 2012. which statement best compares the spread of the data sets
Answers: 2
Mathematics, 22.06.2019 03:00, jonquil201
Benjamin believes that ¼ % is equivalent to 25%. is he correct? why or why not?
Answers: 1
Do you know the correct answer?
3.
use the graph of methods of transportation to a city park to answer the question.
use the graph of methods of transportation to a city park to answer the question.
Questions in other subjects:
Mathematics, 12.07.2019 22:20


History, 12.07.2019 22:20
Mathematics, 12.07.2019 22:20


