

Mathematics, 23.10.2019 03:20, atifgujar
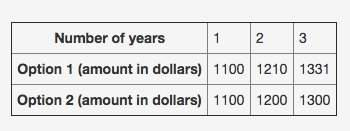
Belinda wants to invest $1000. the table below shows the value of her investment under two different options for three different years:
i think that it is a linear function because i checked it on desmos.
(see attached image.)
part a: what type of function, linear or exponential, can be used to describe the value of the investment after a fixed number of years using option 1 and option 2? explain your answer. (2 points)
part b: write one function for each option to describe the value of the investment f(n), in dollars, after n years. (4 points)
part c: belinda wants to invest in an option that would to increase her investment value by the greatest amount in 20 years. will there be any significant difference in the value of belinda's investment after 20 years if she uses option 2 over option 1? explain your answer, and show the investment value after 20 years for each option. (4 points)

Answers: 1


Other questions on the subject: Mathematics
Mathematics, 21.06.2019 19:40, Candieboo4006
It appears that people who are mildly obese are less active than leaner people. one study looked at the average number of minutes per day that people spend standing or walking. among mildly obese people, the mean number of minutes of daily activity (standing or walking) is approximately normally distributed with mean 376 minutes and standard deviation 64 minutes. the mean number of minutes of daily activity for lean people is approximately normally distributed with mean 528 minutes and standard deviation 107 minutes. a researcher records the minutes of activity for an srs of 7 mildly obese people and an srs of 7 lean people. use z-scores rounded to two decimal places to answer the following: what is the probability (image for it appears that people who are mildly obese are less active than leaner people. one study looked at the averag0.0001) that the mean number of minutes of daily activity of the 6 mildly obese people exceeds 420 minutes? what is the probability (image for it appears that people who are mildly obese are less active than leaner people. one study looked at the averag0.0001) that the mean number of minutes of daily activity of the 6 lean people exceeds 420 minutes?
Answers: 1
Mathematics, 21.06.2019 22:30, 20alondra04
Explain how you could use the interactive table to tell if sets of points are on the same line. math 8
Answers: 2
Mathematics, 22.06.2019 00:20, Jaymiegrimes22
Traffic on saturday, it took ms. torres 24 minutes to drive 20 miles from her home to her office. during friday's rush hour, it took 75 minutes to drive the same distance. a. what was ms. torres's average speed in miles per hour on saturday? b. what was her average speed in miles per hour on friday?
Answers: 1
Do you know the correct answer?
Belinda wants to invest $1000. the table below shows the value of her investment under two different...
Questions in other subjects:

Business, 10.03.2021 22:20

History, 10.03.2021 22:20
Mathematics, 10.03.2021 22:20
Mathematics, 10.03.2021 22:20
Mathematics, 10.03.2021 22:20
Mathematics, 10.03.2021 22:20

Mathematics, 10.03.2021 22:20


