

Mathematics, 20.10.2019 21:30, Sadaalcala1
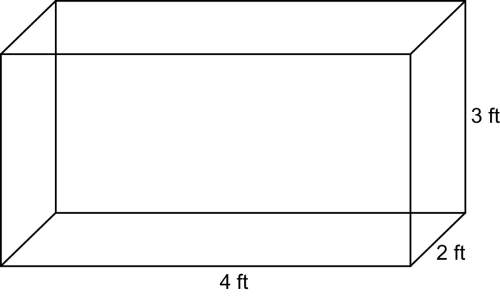
Leo made a container to store his camping gear. the container is in the shape of a rectangular prism. the container has material covering all six sides.
(a) what is the capacity of the container?
(b) how much material was used to make the container?

Answers: 3


Other questions on the subject: Mathematics
Mathematics, 21.06.2019 18:20, acharity196
Do social recommendations increase ad effectiveness? a study of online video viewers compared viewers who arrived at an advertising video for a particular brand by following a social media recommendation link to viewers who arrived at the same video by web browsing. data were collected on whether the viewer could correctly recall the brand being advertised after seeing the video. the results are given below. correctly recalled the brandarrival 409153browsing20484b. conduct the hypothesis test, using the 0.025 level of significance. what is the value of the test statistic? χ2stat=what is the p-value? p-value=is this value significant atα=0.025?
Answers: 2
Mathematics, 21.06.2019 18:30, liltay12386
F(x)=x^3+4 question 6 options: the parent function is shifted up 4 units the parent function is shifted down 4 units the parent function is shifted left 4 units the parent function is shifted right 4 units
Answers: 1
Mathematics, 21.06.2019 20:00, madisonrosamond99
Guys i need ! graded assignment grade 8 checkpoint 2, part 2 answer the questions below. when you are finished, submit this assignment to your teacher by the due date for full credit. total score: of 9 points (score for question 1: of 4 points) 1. the cost of renting a car for a day is $0.50 per mile plus a $15 flat fee. (a) write an equation to represent this relationship. let x be the number of miles driven and y be the total cost for the day. (b) what does the graph of this equation form on a coordinate plane? explain. (c) what is the slope and the y-intercept of the graph of the relationship? explain.
Answers: 1
Mathematics, 22.06.2019 01:00, s27511583
The weight of 46 new patients of a clinic from the year 2018 are recorded and listed below. construct a frequency distribution, using 7 classes. then, draw a histogram, a frequency polygon, and an ogive for the data, using the relative information from the frequency table for each of the graphs. describe the shape of the histogram. data set: 130 192 145 97 100 122 210 132 107 95 210 128 193 208 118 196 130 178 187 240 90 126 98 194 115 212 110 225 187 133 220 218 110 104 201 120 183 124 261 270 108 160 203 210 191 180 1) complete the frequency distribution table below (add as many rows as needed): - class limits - class boundaries - midpoint - frequency - cumulative frequency 2) histogram 3) frequency polygon 4) ogive
Answers: 1
Do you know the correct answer?
Leo made a container to store his camping gear. the container is in the shape of a rectangular prism...
Questions in other subjects:


