
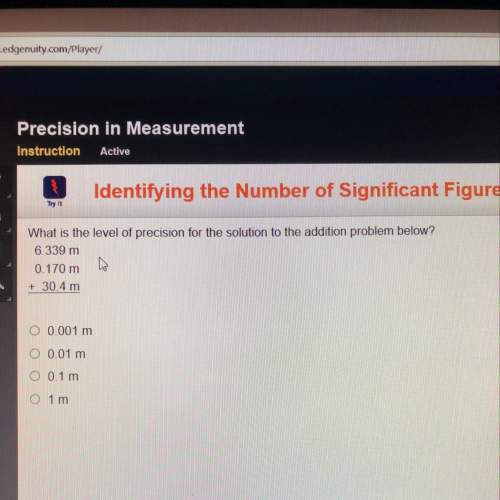


The graph shows the amount of money paid when purchasing bags of candy at the zoo:
a g...

Mathematics, 27.01.2020 21:31, Admin
The graph shows the amount of money paid when purchasing bags of candy at the zoo:
a graph is shown. the x-axis is labeled from 0 to 9. the y-axis is labeled from 0 to 10. the four points shown on the graph are ordered pairs 0, 0 and 1, 2 and 2, 4 and 3, 6. these points are joined by a line. the label on the x-axis is bags of candy. the title on the y-axis is total cost in dollars.
write an equation to represent the relationship between the total cost (y) and the number of bags of candy (x).
y = one-half x
y = 2x
y = 3x
y = one-third x

Answers: 3
Other questions on the subject: Mathematics
Mathematics, 21.06.2019 15:30, elizabethburkha
Determine whether the set of whole numbers is closed under addition. explain why the set is or is not closed. give an example.
Answers: 1
Mathematics, 21.06.2019 22:00, nijanicole164
Out of 50 students surveyed, 16 have a dog. based on these results, predict how many of the 280 students in the school have a dog.
Answers: 2
Do you know the correct answer?
Questions in other subjects:

Physics, 24.03.2020 23:12


Mathematics, 24.03.2020 23:12


