

Mathematics, 22.08.2019 15:20, ashylynn2423
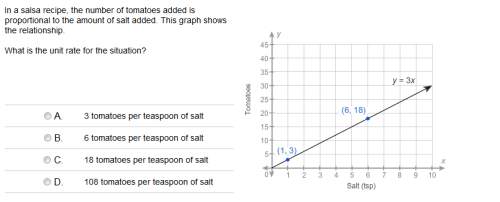
In a salsa recipe, the number of tomatoes added is proportional to the amount of salt added. this graph shows the relationship.
what is the unit rate for the situation?
a.
3 tomatoes per teaspoon of salt
b.
6 tomatoes per teaspoon of salt
c.
18 tomatoes per teaspoon of salt
d.
108 tomatoes per teaspoon of salt

Answers: 2


Other questions on the subject: Mathematics
Mathematics, 21.06.2019 15:00, gabbyypadron
What are the relative frequencies to the nearest hundredth of the columns of the two-way table? a b group 1 102 34 group 2 18 14
Answers: 1
Mathematics, 22.06.2019 02:30, misk980
Atrain traveled for 1.5 hours to the first station, stopped for 30 minutes, then traveled for 4 hours to the final station where it stopped for 1 hour. the total distance traveled is a function of time. which graph most accurately represents this scenario? a graph is shown with the x-axis labeled time (in hours) and the y-axis labeled total distance (in miles). the line begins at the origin and moves upward for 1.5 hours. the line then continues upward at a slow rate until 2 hours. from 2 to 6 hours, the line continues quickly upward. from 6 to 7 hours, it moves downward until it touches the x-axis a graph is shown with the axis labeled time (in hours) and the y axis labeled total distance (in miles). a line is shown beginning at the origin. the line moves upward until 1.5 hours, then is a horizontal line until 2 hours. the line moves quickly upward again until 6 hours, and then is horizontal until 7 hours a graph is shown with the axis labeled time (in hours) and the y-axis labeled total distance (in miles). the line begins at the y-axis where y equals 125. it is horizontal until 1.5 hours, then moves downward until 2 hours where it touches the x-axis. the line moves upward until 6 hours and then moves downward until 7 hours where it touches the x-axis a graph is shown with the axis labeled time (in hours) and the y-axis labeled total distance (in miles). the line begins at y equals 125 and is horizontal for 1.5 hours. the line moves downward until 2 hours, then back up until 5.5 hours. the line is horizontal from 5.5 to 7 hours
Answers: 1
Do you know the correct answer?
In a salsa recipe, the number of tomatoes added is proportional to the amount of salt added. this gr...
Questions in other subjects:
Mathematics, 30.08.2021 08:30

History, 30.08.2021 08:30
Mathematics, 30.08.2021 08:30
History, 30.08.2021 08:30
Mathematics, 30.08.2021 08:30

Physics, 30.08.2021 08:30
Mathematics, 30.08.2021 08:30


