


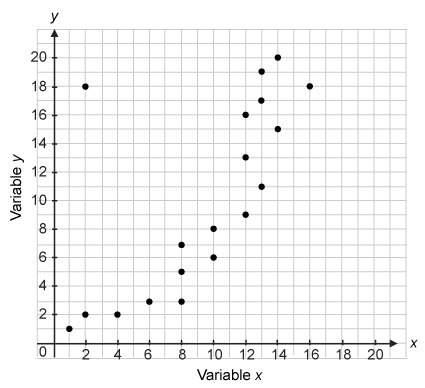
1.) which statement correctly describe the data shown in the scatter plot?

Mathematics, 16.01.2020 09:31, giuliabril
Me
1.) which statement correctly describe the data shown in the scatter plot?
a. the scatter plot shows a positive association.
b. the scatter plot shows no association.
c. the point (18, 2) is an outlier.
d. the scatter plot shows a linear association.

Answers: 2
Other questions on the subject: Mathematics
Mathematics, 21.06.2019 12:30, ggpro4life3000
The graph of the quadratic function shown on the left is y = –0.7(x + 3)(x – 4). the roots, or zeros, of the function are . determine the solutions to the related equation 0 = –0.7(x + 3)(x – 4). the solutions to the equation are x =
Answers: 1
Mathematics, 21.06.2019 16:30, VgCarlos2596
What are “like terms”? why can we only add like terms?
Answers: 1
Do you know the correct answer?
Me
1.) which statement correctly describe the data shown in the scatter plot?
1.) which statement correctly describe the data shown in the scatter plot?
Questions in other subjects:


Mathematics, 22.11.2019 04:31


