

Mathematics, 17.10.2019 10:00, jamayeah02
leticia invests $200 at 5% interest. if y represents the amount of money after x time periods, which describes the graph of the exponential function relating time and money?
the initial value of the graph is 200. the graph increases by a factor of 1.05 per 1 unit increase in time.
the initial value of the graph is 200. the graph increases by a factor of 5 per 1 unit increase in time.
the initial value of the graph is 500. the graph increases by a factor of 2 per 1 unit increase in time.
the initial value of the graph is 500. the graph increases by a factor of 1.02 per 1 unit increase in time.

Answers: 2
 y = final amount ; A = initial value ; r = growth rate
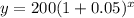


Other questions on the subject: Mathematics
Mathematics, 21.06.2019 15:30, lyndamahe0
Come up with a new linear function that has a slope that falls in the range 10 m − < < . choose two different initial values. for this new linear function, what happens to the function’s values after many iterations? are the function’s values getting close to a particular number in each case?
Answers: 1
Mathematics, 21.06.2019 20:30, yeetmaster7688
Find the value of x for which line a is parallel to line b
Answers: 1
Do you know the correct answer?
leticia invests $200 at 5% interest. if y represents the amount of money after x time periods, which...
Questions in other subjects:

Social Studies, 15.07.2019 02:50

Business, 15.07.2019 02:50

History, 15.07.2019 02:50

Biology, 15.07.2019 02:50
Social Studies, 15.07.2019 02:50
Biology, 15.07.2019 02:50
Biology, 15.07.2019 02:50


