


Use the data to create a scatter plot.
time (years) number of participants
(x100...

Mathematics, 31.01.2020 20:58, eve2055
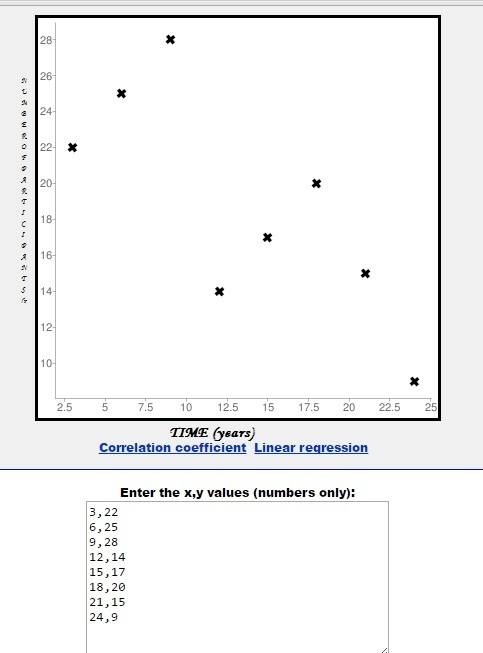
Use the data to create a scatter plot.
time (years) number of participants
(x1000) 3 22 6 25 9 28 12 14 15 17 18 20 21 15 24 9

Answers: 2
Other questions on the subject: Mathematics
Mathematics, 21.06.2019 14:00, lovelysoul4698
You and a friend race across a field to a fence and back. your friend has a 50-meter head start. the equations shown represent you and your friend's distances dd (in meters) from the fence tt seconds after the race begins. find the time at which you catch up to your friend. you: d=∣−5t+100∣d=∣−5t+100∣ your friend: d=∣−313t+50∣∣
Answers: 2
Mathematics, 21.06.2019 22:10, bigboss3026
Which of the following circles have their centers in the third quadrant?
Answers: 2
Mathematics, 21.06.2019 23:30, michaellangley
Consider the input and output values for f(x) = 2x - 3 and g(x) = 2x + 7. what is a reasonable explanation for different rules with different input values producing the same sequence?
Answers: 1
Do you know the correct answer?
Questions in other subjects:


Mathematics, 25.11.2021 06:10


Geography, 25.11.2021 06:10


SAT, 25.11.2021 06:10


