


Plz
the scatter plot shows the relationship between the number of car accidents in a mon...

Mathematics, 18.12.2019 00:31, tuetheturtle
Plz
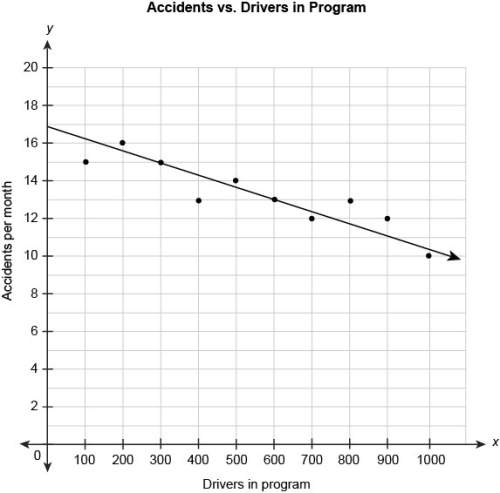
the scatter plot shows the relationship between the number of car accidents in a month and the number of drivers attending a program on distracted driving. the equation represents the linear model for this data.
y = -0.67x + 17
what does the number -0.67 in the equation mean in this context?
a .there were 0.67 accidents per month.
b. the number of accidents was reduced by 0.67 per month every month.
c. the number of accidents was reduced by 0.67 per month for every additional driver in the program.
d. the number of accidents was reduced by 0.67 per month for every additional 100 drivers in the program
e. the number of accidents increased by 0.67 per month for every additional 100 drivers in the program

Answers: 3
Other questions on the subject: Mathematics
Mathematics, 21.06.2019 23:40, notearslefttocry14
What is the area of a rectangle with vertices (-8,-2), (-3,-2), (-3,-6), and (-8,-6)? units
Answers: 1
Mathematics, 22.06.2019 01:00, rexerlkman4145
Mia’s gross pay is 2953 her deductions total 724.15 what percent if her gross pay is take-home pay
Answers: 2
Do you know the correct answer?
Questions in other subjects:


Mathematics, 31.01.2020 06:52

English, 31.01.2020 06:52


