

Mathematics, 02.09.2019 18:30, cpcoolestkid4
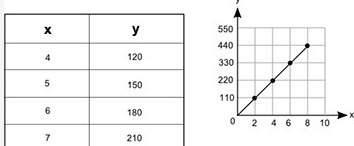
The table and the graph below each show a different relationship between the same two variables, x and y:
*insert attached picture here*
how much more would the value of y be on the graph than its value in the table when x = 12?
i added the y values for both until i got twelve and i subtracted the table's final y value from the graph's. i ended up with 410 but the only answer choices are:
150
300
450
600
what am i doing wrong?

Answers: 1


Other questions on the subject: Mathematics
Mathematics, 21.06.2019 19:30, santileiva123199
Factor the following expression. 27y3 – 343 a. (3y + 7)(9y2 + 2ly + 49) b. (3y – 7)(9y2 + 2ly + 49) c. (3y – 7)(932 – 217 + 49) d. (3y + 7)(92 – 2ly + 49)
Answers: 1
Do you know the correct answer?
The table and the graph below each show a different relationship between the same two variables, x a...
Questions in other subjects:
Mathematics, 20.10.2019 10:50
Mathematics, 20.10.2019 10:50


SAT, 20.10.2019 10:50
Mathematics, 20.10.2019 10:50

Social Studies, 20.10.2019 10:50


English, 20.10.2019 10:50

Biology, 20.10.2019 10:50


