


Can someone backmeup here
the scatter plot shows the relationship between the average nu...

Mathematics, 09.10.2019 14:30, tdyson3p6xvtu
Can someone backmeup here
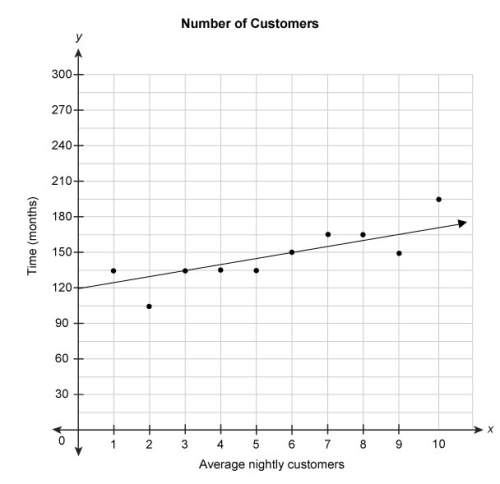
the scatter plot shows the relationship between the average number of nightly customers and the number of months since a restaurant opened. the equation represents the linear model for this data.
y = 5x + 20
what does the number 5 in the equation mean in this context?
the restaurant has been open for 5 months.
there were 5 customers per month after the restaurant was open 120 months.
the average number of customers per night increased by 5 each month.
there were 5 customers per night when the restaurant opened.
for every 5 months the restaurant has been open, there are 120 more customers per night.

Answers: 1
Other questions on the subject: Mathematics
Mathematics, 21.06.2019 19:00, AbhiramAkella
You earn a 12% commission for every car you sell. how much is your commission if you sell a $23,000 car?
Answers: 1
Mathematics, 21.06.2019 22:00, tatertottheyoungin
If x+y+z=0 what is the value of [tex] {x}^{3} + {y}^{3} + {z}^{3} [/tex]
Answers: 2
Mathematics, 22.06.2019 00:00, normakite
The function y= x - 4x+ 5 approximates the height, y, of a bird, and its horizontal distance, x, as it flies from one fence post to another. all distances are in feet. complete the square to find and interpret the extreme value (vertex). select two answers: one extreme value and one interpretation.
Answers: 2
Do you know the correct answer?
Questions in other subjects:
Mathematics, 22.04.2020 23:11
Mathematics, 22.04.2020 23:11


