Mathematics, 29.01.2020 22:59, Cobetate
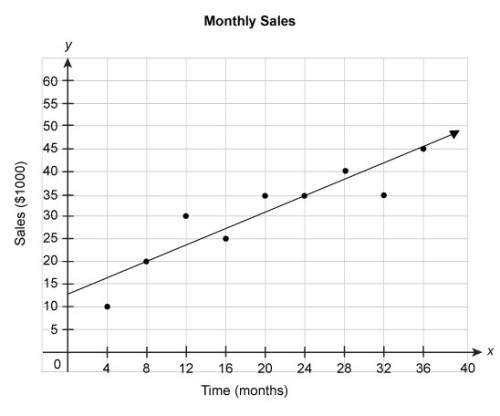
An employee compiled sales data for a company once each month. the scatter plot below shows the sales (in multiples of $1000) for the company over time (in months). the equation represents the linear model for this data.
y = 0.94x + 12.5
according to the model, what will the company's sales be after 40 months?
enter your answer in the box.


Answers: 2
Other questions on the subject: Mathematics

Mathematics, 21.06.2019 17:00, sunshine52577oyeor9
Aquantity with an initial value of 3900 decays exponentially at a rate of 35% every hour. what is the value of the quantity after 0.5 days, to the nearest hundredth?
Answers: 1


Mathematics, 21.06.2019 18:50, adriana145
The trigonometric ratios sine and secant are reciprocals of each other
Answers: 2

Mathematics, 21.06.2019 20:00, rogelionavarro200314
Evaluate the discriminant of each equation. tell how many solutions each equation has and whether the solutions are real or imaginary. x^2 + 4x + 5 = 0
Answers: 2
Do you know the correct answer?
An employee compiled sales data for a company once each month. the scatter plot below shows the sale...
Questions in other subjects:


History, 08.12.2020 01:00


English, 08.12.2020 01:00

Mathematics, 08.12.2020 01:00


Health, 08.12.2020 01:00


