

Mathematics, 18.01.2020 00:31, jamarstand
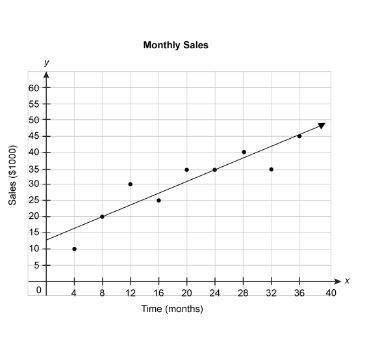
An employee compiled sales data for a company once each month. the scatter plot below shows the sales (in multiples of $1000) for the company over time (in months). the equation represents the linear model for this data.
y = 0.94x + 12.5
according to the model, how much do the company's sales increase per month?
$9400
$12,500
$1250
$5000
$940

Answers: 1


Other questions on the subject: Mathematics
Mathematics, 21.06.2019 14:30, garrettrhoad
The amount of money, in dollars, in an account after t years is given by a = 1000(1.03)^t. the initial deposit into the account was $_^a0 and the interest rate was _a1% per year. only enter numbers in the boxes. do not include any commas or decimal points^t. the initial deposit into the account was $__^a0 and the interest rate is % per year.
Answers: 2
Mathematics, 21.06.2019 21:40, salinasroel22
In a survey of 1015 adults, a polling agency asked, "when you retire, do you think you will have enough money to live comfortably or not. of the 1015 surveyed, 534 stated that they were worried about having enough money to live comfortably in retirement. construct a 90% confidence interval for the proportion of adults who are worried about having enough money to live comfortably in retirement.
Answers: 3
Mathematics, 22.06.2019 03:50, laryans317
One x-intercept for a parabola is at the point (-0.33,0). use the quadratic formula to find the other x-intercept for the parabola defined by the equation y=-3x^2+5x+2
Answers: 1
Do you know the correct answer?
An employee compiled sales data for a company once each month. the scatter plot below shows the sale...
Questions in other subjects:


Geography, 02.08.2019 03:30

Spanish, 02.08.2019 03:30

Social Studies, 02.08.2019 03:30

English, 02.08.2019 03:30


