

Mathematics, 02.10.2019 13:10, chamarabrown6529
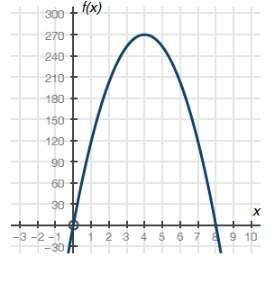
The graph below shows a company's profit f(x), in dollars, depending on the price of erasers x, in dollars, being sold by the company:
graph of quadratic function f of x having x intercepts at ordered pairs 0, 0 and 8, 0. the vertex is at 4, 270
part a: what do the x-intercepts and maximum value of the graph represent? what are the intervals where the function is increasing and decreasing, and what do they represent about the sale and profit?
part b: what is an approximate average rate of change of the graph from x = 1 to x = 4, and what does this rate represent?

Answers: 1


Other questions on the subject: Mathematics
Mathematics, 21.06.2019 20:30, kaliyaht01
The frequency table shows the results of a survey comparing the number of beach towels sold for full price and at a discount during each of the three summer months. the store owner converts the frequency table to a conditional relative frequency table by row. which value should he use for x? round to the nearest hundredth. 0.89 0.90 0.92 0.96
Answers: 2
Mathematics, 21.06.2019 23:00, londonchanel
Sara made $253 for 11 hours of work. at the same rate how much would he make for 7 hours of work?
Answers: 2
Do you know the correct answer?
The graph below shows a company's profit f(x), in dollars, depending on the price of erasers x, in d...
Questions in other subjects:

Spanish, 21.05.2020 04:10


Mathematics, 21.05.2020 04:10

Physics, 21.05.2020 04:10
Mathematics, 21.05.2020 04:10
Mathematics, 21.05.2020 04:10


