


Agroup of 23 students participated in a math competition. their scores are below:
scor...

Mathematics, 26.09.2019 16:50, mike2910
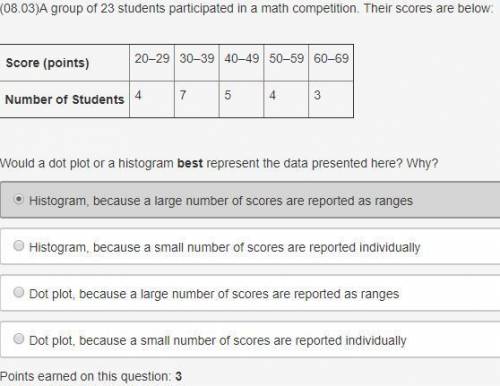
Agroup of 23 students participated in a math competition. their scores are below:
score (points) 20–29 30–39 40–49 50–59 60–69
number of students 4 7 5 4 3
would a dot plot or a histogram best represent the data presented here? why?
histogram, because a large number of scores are reported as ranges
histogram, because a small number of scores are reported individually
dot plot, because a large number of scores are reported as ranges
dot plot, because a small number of scores are reported individually

Answers: 2
Other questions on the subject: Mathematics
Mathematics, 21.06.2019 16:00, lymariluna73016
Abag has more green balls than blue balls, and there is at least one blue ball. let bb represent the number of blue balls and let gg represent the number of green balls. let's compare the expressions 2b2b and b + gb+g. which statement is correct? choose 1
Answers: 2
Mathematics, 21.06.2019 20:30, esnyderquintero
Find the area of the triangle formed by the origin and the points of intersection of parabolas y=−3x^2+20 and y=x^2−16.
Answers: 3
Mathematics, 21.06.2019 21:50, godzilla24
If you double the input of a function and it results in half the output, and if you triple the input and it results in a third of the output, what can be guessed about the function? check all that apply.
Answers: 3
Do you know the correct answer?
Questions in other subjects:

Mathematics, 20.08.2020 01:01


