

Mathematics, 29.01.2020 07:54, velaskawallv
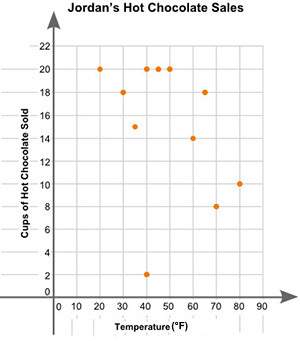
Jordan plotted the graph below to show the relationship between the temperature of his city and the number of cups of hot chocolate he sold daily:
part a: in your own words, describe the relationship between the temperature of the city and the number of cups of hot chocolate sold. (2 points)
part b: describe how you can make the line of best fit. write the approximate slope and y-intercept of the line of best fit. show your work. (3 points)

Answers: 3


Other questions on the subject: Mathematics
Mathematics, 21.06.2019 17:00, lefarrioe8621
The size of a certain cell is 2.5*10^-9m. another cell is 1.5*10^3 times larger. how large is the larger cell in scientific notation?
Answers: 2
Mathematics, 21.06.2019 19:20, sierravick123owr441
Ab and bc form a right angle at point b. if a= (-3,-1) and b= (4,4) what is the equation of bc?
Answers: 1
Mathematics, 21.06.2019 21:00, maddyleighanne
Suppose that in 2008 , 840,800 citizens died of a certain disease assuming the population of teh country is 399 miliion, what is the mortality rate in units of deaths per 100,000 people?
Answers: 1
Mathematics, 22.06.2019 00:00, salgadoj6933
Cody ran nine miles on his first day of training. the next day he ran 1/8 that distance. how far did he run the second day?
Answers: 2
Do you know the correct answer?
Jordan plotted the graph below to show the relationship between the temperature of his city and the...
Questions in other subjects:


Business, 07.01.2021 19:10
Mathematics, 07.01.2021 19:10
Mathematics, 07.01.2021 19:10


