

Mathematics, 18.10.2019 08:00, bekzod37
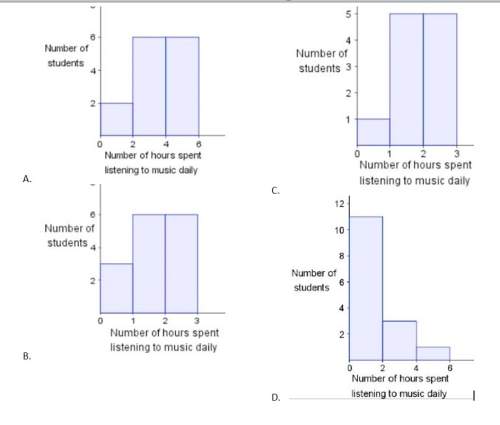
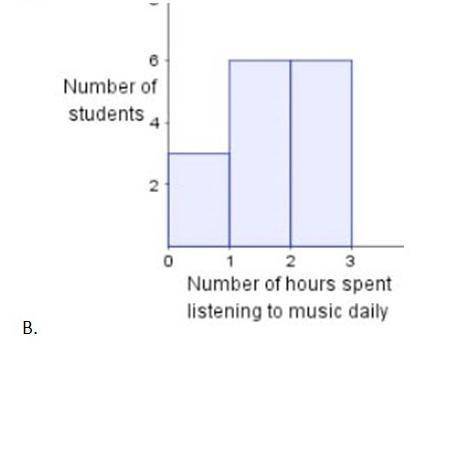
The following table shows the number of hours some students of a of a class listen to music each day.
student: hours:
a 0.6
b 0.5
c 2.5
d 2.5
e 1.5
f 2.5
g 0.5
h 1.5
i 1.5
j 2.5
k 2.5
l 2.5
m 1.5
n 1.5
o 1.5
which histogram best represents the data?

Answers: 2


Other questions on the subject: Mathematics
Mathematics, 21.06.2019 19:40, mathman783
F(x) = 1/x g(x)=x-4 can you evaluate (g*f)(0) ? why or why not?
Answers: 1
Do you know the correct answer?
The following table shows the number of hours some students of a of a class listen to music each day...
Questions in other subjects:


