


Need with these 5 !
#1 the graph shows a journey in a car. which of the statements mos...

Mathematics, 02.11.2019 21:31, jalisabarnes12401
Need with these 5 !
#1 the graph shows a journey in a car. which of the statements most likely describes the journey at the portion of the graph labeled k?
a line graph is drawn on the first quadrant of a coordinate plane. the x axis is labeled time in seconds, and the y axis is labeled distance in miles. the line graph is divided into 7 segments labeled i, j, k, l, m, n, and o. i starts at the origin and is a straight line slanting up. j is a line segment that starts at the end of i and is horizontal. k is a curve that starts at the end of j and curves up. l is a straight line that starts at the end of k and is horizontal. m is a straight line that starts at the end of l and slopes down. n is a straight line that starts at the end of m and is horizontal. o is a curve that starts at the end of n and curves down to finally touch the x axis.
the car travels the same distance per unit of time because the portion shows a linear, increasing function.
the car travels different distances per unit of time because the portion shows a linear, increasing function.
the car travels different distances per unit of time because the portion shows a nonlinear, increasing function.
the car travels the same distance per unit of time because the portion shows a nonlinear, increasing function.
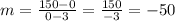
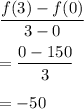
#2 he graph below plots a function f(x):
graph of line segment going through ordered pairs 0,150 and 3, 0
if x represents time, the average rate of change of the function f(x) in the first three seconds is
#3 the tables below show the values of y corresponding to different values of x:
table a
x 3 3 2
y 1 0 0
table b
x 3 5 5
y −2 2 −2
which statement is true for the tables?
both table a and table b represent functions.
both table a and table b do not represent functions.
table a does not represent a function, but table b represents a function.
table a represents a function, but table b does not represent a function.
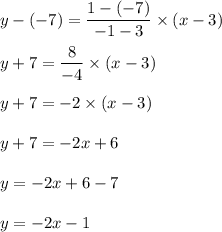
#4 what is the slope of the line that passes through (3, −7) and (−1, 1)?
undefined
0
−2
2
#5 state the domain of the relation.
discrete graph defined on the set of points negative two comma negative four and zero comma zero and positive one comma positive one and positive two comma positive two and positive three comma positive one and positive four comma positive six.
{−2, 0, 1, 2, 3, 4}
{−4, 0, 1, 2, 6}
{0, 1, 2, 3}
{−2, 4}

Answers: 3
Other questions on the subject: Mathematics
Mathematics, 21.06.2019 13:00, elviaortiz402373
What is the equation of the graph that represents f(x)=x^4 stretched vertically by 2 and shifted up 3 spaces
Answers: 1
Mathematics, 21.06.2019 18:00, destineenikole17
In what organelle does photosynthesis take place?
Answers: 2
Mathematics, 21.06.2019 22:00, reesewaggoner8
Uestion 1(multiple choice worth 5 points) (05.02)alex wants to paint one side of his skateboard ramp with glow-in-the-dark paint, but he needs to know how much area he is painting. calculate the area of the isosceles trapezoid. isosceles trapezoid with top base 12 feet, bottom base of 18 feet, and height of 6 feet. 72 ft2 84 ft2 90 ft2 108 ft2
Answers: 1
Do you know the correct answer?
Questions in other subjects:

Biology, 20.11.2020 21:50
Mathematics, 20.11.2020 21:50
Mathematics, 20.11.2020 21:50

History, 20.11.2020 21:50

Chemistry, 20.11.2020 21:50
Chemistry, 20.11.2020 21:50
Mathematics, 20.11.2020 21:50


