

Mathematics, 17.04.2021 05:20, ghostshadow1
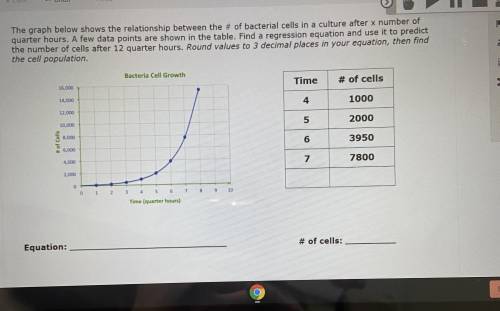
The graph below shows the relationship between the # of bacterial cells in a culture after x number of quarter hours. A few data points are shown in the table. Find a regression equation and use it to predict the number of cells after 12 quarter hours. Round values to 3 decimal places in your equation, then find the cell population.

Answers: 1


Other questions on the subject: Mathematics
Mathematics, 21.06.2019 13:50, heavendl13
James wants to promote his band on the internet. site a offers website hosting for $4.95 per month with a $49.95 startup fee. site b offers website hosting for $9.95 per month with no startup fee. for how many months would james need to keep the website for site a to be a better choice than site b? define a variable for the situation. write an inequality that represents the situation. solve the inequality to find out how many months he needs to keep the website for site a to be less expensive than site b. using words, describe how many months he needs to keep the website for site a to be less expensive than site b.
Answers: 1
Mathematics, 21.06.2019 18:00, jedsgorditas
The los angels ram scored 26, 30, 48, and 31 pts in their last four games. how many pts do they need to score in super bowl liii in order to have an exact mean average of 35 pts over five games. write and solve and equation. use x to represent the 5th game.
Answers: 1
Mathematics, 21.06.2019 18:30, gabrielaaaa1323
At the olympic games, many events have several rounds of competition. one of these events is the men's 100-meter backstroke. the upper dot plot shows the times (in seconds) of the top 8 finishers in the final round of the 2012 olympics. the lower dot plot shows the times of the same 8 swimmers, but in the semifinal round. which pieces of information can be gathered from these dot plots? (remember that lower swim times are faster.) choose all answers that apply: a: the swimmers had faster times on average in the final round. b: the times in the final round vary noticeably more than the times in the semifinal round. c: none of the above.
Answers: 2
Do you know the correct answer?
The graph below shows the relationship between the # of bacterial cells in a culture after x number...
Questions in other subjects:
Mathematics, 17.10.2020 20:01


Mathematics, 17.10.2020 20:01


