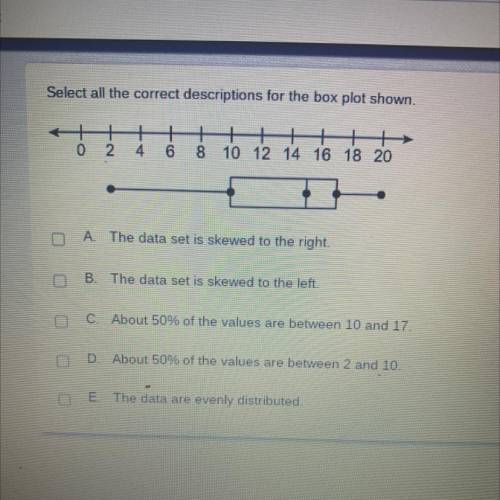
Select all the correct descriptions for the box plot shown.
++
4
0
2
6
8 10 12 14 16 18 20
A. The data set is skewed to the right.
B. The data set is skewed to the left.
C About 50% of the values are between 10 and 17.
D. About 50% of the values are between 2 and 10.
E. The data are evenly distributed.
Phillip had some bricks. he stacked them in 6 equal piles. which expression shows the number of bricks phillip put in each pile? let the variable m stand for the unknown number of bricks. m + 6 m÷6 m−6 6m