

Mathematics, 15.04.2021 20:50, nakarelinp0p303
A scatter plot is shown below:
A graph shows numbers from 0 to 10 on the x axis at increments of 1 and the numbers 0 to 15 on the y axis at increments of 1. The ordered pairs 0, 14 and 1, 11 and 2, 9 and 3, 10 and 4, 7 and 5, 7 and 6, 5 and 7, 5 and 8, 3 and 9, 1 and 10, 0 are shown on the graph.
Which two ordered pairs can be joined to best draw the line of best fit for this scatter plot?
(4, 15) and (10, 7)
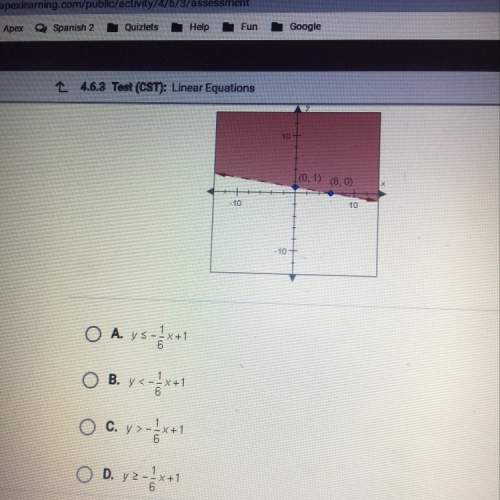
(1, 6) and (6, 0)
(0, 13) and (10, 11)
(0, 13) and (10, 0)

Answers: 3


Other questions on the subject: Mathematics
Mathematics, 21.06.2019 21:20, DisneyGirl11
The edge of a cube was found to be 30 cm with a possible error in measurement of 0.4 cm. use differentials to estimate the maximum possible error, relative error, and percentage error in computing the volume of the cube and the surface area of the cube. (round your answers to four decimal places.) (a) the volume of the cube maximum possible error cm3 relative error percentage error % (b) the surface area of the cube maximum possible error cm2 relative error percentage error %
Answers: 3
Mathematics, 21.06.2019 23:00, serenityburke
The areas of two similar triangles are 72dm2 and 50dm2. the sum of their perimeters is 226dm. what is the perimeter of each of these triangles?
Answers: 1
Mathematics, 21.06.2019 23:00, BaileyElizabethRay
Find the distance between c and d on the number line c=3 and d=11
Answers: 1
Do you know the correct answer?
A scatter plot is shown below:
A graph shows numbers from 0 to 10 on the x axis at increments of 1...
Questions in other subjects:

History, 07.10.2020 08:01

Mathematics, 07.10.2020 08:01

Social Studies, 07.10.2020 08:01

Geography, 07.10.2020 08:01
History, 07.10.2020 08:01
Mathematics, 07.10.2020 08:01


