

Mathematics, 14.04.2021 20:40, jacamron
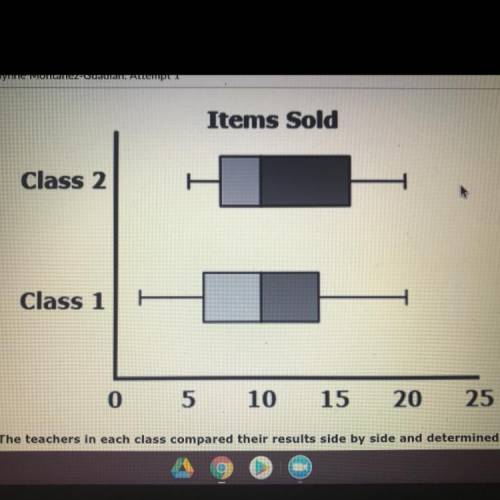
The graph shown is a summary of the number of items sold by two classes for a school fundraiser.
The teachers in each class compared their results side by side and determined that class 1 had more variability than Class 2. Which of the following statements BEST describes the conclusion of the teachers?
A. It is not true because the median for each class is the same
B. It is not true because the maximum is the same for each class
C. It is true because the range of Class 1 is greater than the range of Class 2
D. It is true because the minimum for Class 1 is less than the minimum of Class 2

Answers: 1


Other questions on the subject: Mathematics
Mathematics, 21.06.2019 22:30, jack487
Graph the system of inequalities presented here on your own paper, then use your graph to answer the following questions: y > 2x + 3y is less than negative 3 over 2 times x minus 4part a: describe the graph of the system, including shading and the types of lines graphed. provide a description of the solution area. (6 points)part b: is the point (â’4, 6) included in the solution area for the system? justify your answer mathematically. (4 points)
Answers: 1
Mathematics, 22.06.2019 00:00, brandon1748
Ascientist studied a population of workers to determine whether verbal praise and/or tangible rewards affect employee productivity. in the study, some workers were offered verbal praise, some were offered tangible rewards (gift cards, presents, and some were offered neither. the productivity of each participant was measured throughout the study by recording the number of daily tasks completed by each employee. which inference might the scientists make based on the given information? a.) the number of daily tasks completed by each employee may influence the dependent variable, which is whether the employee receives verbal praise, tangible rewards, or neither. b.) verbal praise and/or tangible rewards may influence the independent variable, which is the number of daily tasks completed by each employee. c.) verbal praise and/or tangible rewards may influence the dependent variable, which is the number of daily tasks completed by each employee. d.) the dependent variables, which are verbal praise and tangible rewards, may influence the number of daily tasks completed by each employee.
Answers: 1
Mathematics, 22.06.2019 03:30, breexj
Eric and shiloh each have a savings account. the ratio of eric’s account balance to shiloh’s account balance is 4: 3. together they have a total of $140 in their accounts. use the tape diagram below to you determine the balance of eric’s account.
Answers: 2
Do you know the correct answer?
The graph shown is a summary of the number of items sold by two classes for a school fundraiser.
Th...
Questions in other subjects:

Chemistry, 23.06.2019 12:00
Mathematics, 23.06.2019 12:00

English, 23.06.2019 12:00
Mathematics, 23.06.2019 12:00
English, 23.06.2019 12:00
Mathematics, 23.06.2019 12:00
Mathematics, 23.06.2019 12:00
Mathematics, 23.06.2019 12:00

Advanced Placement (AP), 23.06.2019 12:00


