

Mathematics, 14.04.2021 19:40, axelsanchez7710
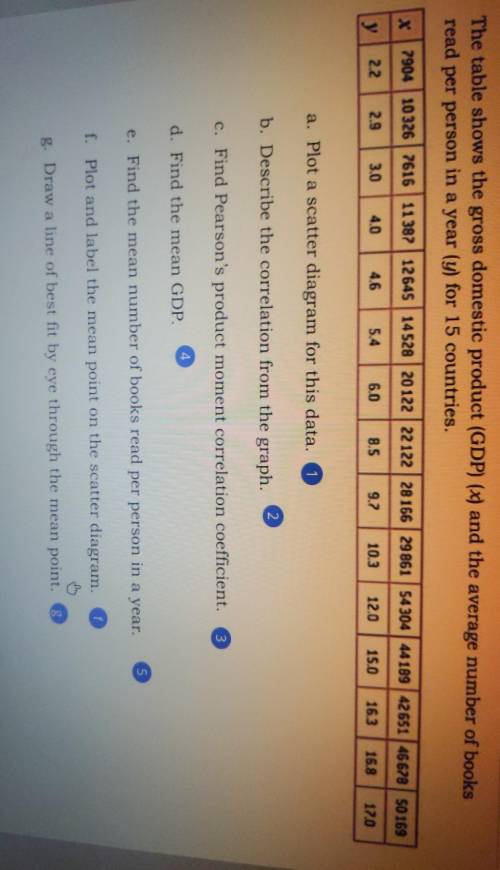
The table shows the gross domestic product (GDP) (x) and the average number of books read per person in a year (y) for 15 countries.
a. Plot a scatter diagram for this data.
b. Describe the correlation from the graph.
c. Find Pearson's product moment correlation coefficient.
d. Find the mean GDP.
e. Find the mean number of books read per person in a year. 5
f. Plot and label the mean point on the scatter diagram.
g. Draw a line of best fit by eye through the mean point.

Answers: 1


Other questions on the subject: Mathematics
Mathematics, 21.06.2019 19:30, ashtonsilvers2003
Evaluate the expression for the given value of the variable. ∣-4b-8∣+∣-1-b^2 ∣+2b^3 ; b=-2
Answers: 2
Mathematics, 21.06.2019 23:50, amayarayne5
Use a transformation to solve the equation. w/4 = 8 can you also leave a detailed explanation on how this equation = 32
Answers: 1
Mathematics, 22.06.2019 01:30, zariah10191101
What is the remainder when 3x^2-x-10 is divided by x-1 -6,-7,-8, or -9
Answers: 1
Do you know the correct answer?
The table shows the gross domestic product (GDP) (x) and the average number of books read per person...
Questions in other subjects:

English, 01.12.2021 21:20
Mathematics, 01.12.2021 21:20
Mathematics, 01.12.2021 21:20


Mathematics, 01.12.2021 21:20
Mathematics, 01.12.2021 21:20


