

Mathematics, 14.04.2021 04:50, arianaaldaz062002
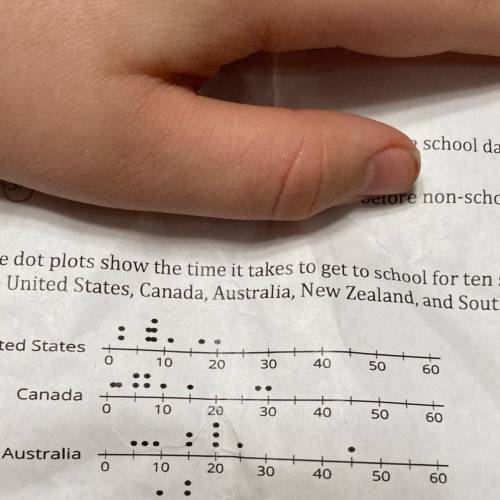
The dot plots show the time it takes to get to school for ten sixth graders Questions are; List the countries in order of typical travel times from shortest to longest List the countries in order of varbilties in travel times from the least to greatest

Answers: 1


Other questions on the subject: Mathematics
Mathematics, 21.06.2019 18:30, isabellacampos4586
It took alice 5 5/6 hours to drive to her grandparents' house for . on the way home, she ran into traffic and it took her 7 3/8 hours. how much longer did the return trip take? write your answer as a proper fraction or mixed number in simplest form. the trip home took __hours longer. ?
Answers: 1
Mathematics, 22.06.2019 03:30, kevenluna10oytivm
At the beginning of a call to the cable company, a message tells customers, "after you finish talking to our customer service representative, you will be asked to take a five-question survey about the level of service you recieved. it would be appreciated if you could stay on the line to answer the survey questions." what type of sampling is the cable company using?
Answers: 3
Do you know the correct answer?
The dot plots show the time it takes to get to school for ten sixth graders Questions are; List the...
Questions in other subjects:


History, 04.08.2019 14:00


Geography, 04.08.2019 14:00
History, 04.08.2019 14:00


