

Mathematics, 14.04.2021 04:40, amandasantiago2001
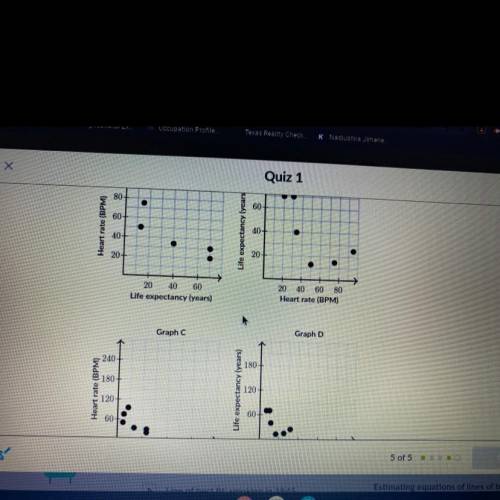
A group of scientists wants to investigate if they can predict the life expectancy of mammal species given
its average heart rate. The table below shows the relationship between average heart rate (in beats per
minute) and life expectancy (in years) for a sample of mammals.
Whale
Horse
Lion
Sheep
Pig
Elephant
30
Average heart rate (BPM)
20
34
50
75
95
Life expectancy (years)
70
70
40
13
15
25
All of the scatter plots below display the dhta correctly, but which one of them displays the data best?
By convention, a good scatter plot uses a reasonable scale on both axes and puts the explanatory variable on the
X-axis.

Answers: 3


Other questions on the subject: Mathematics
Mathematics, 21.06.2019 18:30, issagirl05
Find the exact value of each of the following. in each case, show your work and explain the steps you take to find the value. (a) sin 17π/6 (b) tan 13π/4 (c) sec 11π/3
Answers: 2
Mathematics, 21.06.2019 21:30, karmaxnagisa20
Three friends went on a road trip from phoenix, az, to san diego, ca. mark drove 50 percent of the distance. jason drove 1/8 of the distance. andy drove the remainder of the distance. 1. andy thinks he drove 1/4 of the distance from phoenix, az, to san diego, ca. is andy correct? 2. the distance from phoenix, az, to san diego, ca, is 360 miles. how many miles did each person drive? 3. solve the problem. what is the answer in total?
Answers: 3
Mathematics, 22.06.2019 05:50, naomicervero
Lisa dined at a restaurant and gave the waiter a 15% tip if the price of her meal was $10.25 how much did lisa tip the waiter
Answers: 2
Do you know the correct answer?
A group of scientists wants to investigate if they can predict the life expectancy of mammal species...
Questions in other subjects:
Mathematics, 17.09.2020 08:01
Mathematics, 17.09.2020 08:01
Mathematics, 17.09.2020 08:01

History, 17.09.2020 08:01

Chemistry, 17.09.2020 08:01
Mathematics, 17.09.2020 08:01
Mathematics, 17.09.2020 08:01
Mathematics, 17.09.2020 08:01

Social Studies, 17.09.2020 08:01

English, 17.09.2020 08:01


