


Which values should you plot to show a linear relationship?
Month Population
Log(population)<...

Mathematics, 13.04.2021 03:10, juniorgutierrez997
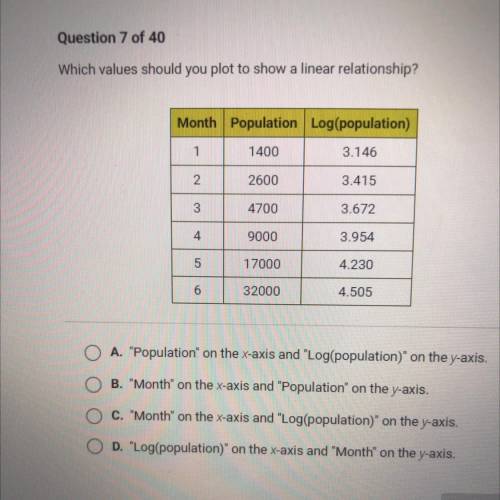
Which values should you plot to show a linear relationship?
Month Population
Log(population)
1
1400
3.146
2
2600
3.415
3
4700
3.672
4
9000
3.954
5
17000
4.230
6
32000
4.505
O A. "Population on the x-axis and "Log(population)" on the y-axis.
O B. "Month" on the x-axis and "Population" on the y-axis.
w
O C. "Month" on the x-axis and "Log(population)" on the y-axis.
O D. "Log(population)" on the x-axis and "Month" on the y-axis.

Answers: 2
Other questions on the subject: Mathematics
Mathematics, 21.06.2019 16:50, jennamae9826
Its worth 10000000 points need asap if you answer correctly ill mark brainliest
Answers: 1
Mathematics, 21.06.2019 22:00, shantejahtierr63961
You're locked out of your house. the only open window is on the second floor, 25 feet above the ground. there are bushes along the edge of the house, so you will need to place the ladder 10 feet from the house. what length ladder do you need to reach the window?
Answers: 3
Do you know the correct answer?
Questions in other subjects:

Social Studies, 12.10.2019 18:10


Computers and Technology, 12.10.2019 18:10

Biology, 12.10.2019 18:10
Mathematics, 12.10.2019 18:10
Mathematics, 12.10.2019 18:10
Mathematics, 12.10.2019 18:10


