

Mathematics, 12.04.2021 22:30, kbrook12
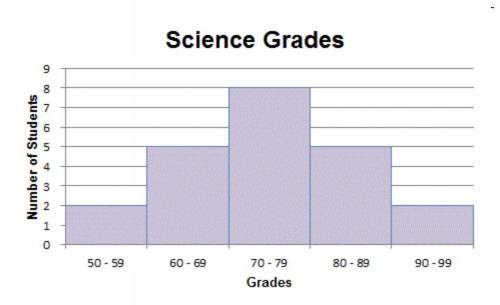
Which statements about the histogram in the picture are true? Check all that apply.
The histogram shows that nine students had grades of 80 or higher.
The histogram shows there were 22 students in the class.
The histogram shows there were 25 students in the class.
The histogram is symmetrical.
The histogram has a peak.
The histogram shows the data is evenly distributed.
The histogram shows a gap in the data.

Answers: 1


Other questions on the subject: Mathematics
Mathematics, 21.06.2019 18:00, jedsgorditas
The los angels ram scored 26, 30, 48, and 31 pts in their last four games. how many pts do they need to score in super bowl liii in order to have an exact mean average of 35 pts over five games. write and solve and equation. use x to represent the 5th game.
Answers: 1
Mathematics, 22.06.2019 01:40, cfigueroablan
Which statement is true about the extreme value of the given quadratic equation? a. the equation has a maximum value with a y-coordinate of -21. b. the equation has a maximum value with a y-coordinate of -27. c. the equation has a minimum value with a y-coordinate of -21. d. the equation has a minimum value with a y-coordinate of -27.
Answers: 1
Do you know the correct answer?
Which statements about the histogram in the picture are true? Check all that apply.
The histogram s...
Questions in other subjects:
Mathematics, 18.03.2020 17:32

Mathematics, 18.03.2020 17:32


Biology, 18.03.2020 17:33
Medicine, 18.03.2020 17:33


