


The constant ratio of

Mathematics, 12.04.2021 16:50, nolanreano
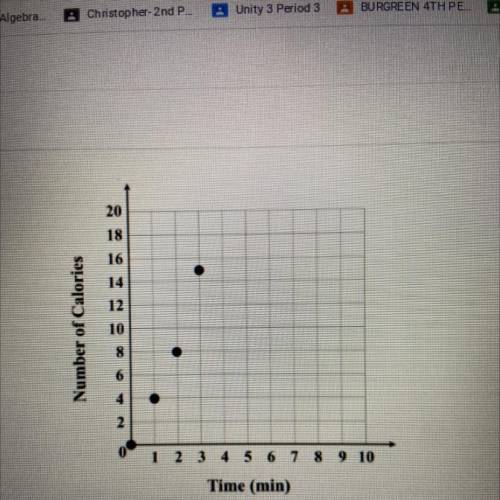
Using the data shown on the graph, which statements are correct?
у
The constant ratio of
A)
is
5 1 / 름
B)
calories burned
The ratio of
time
is not consistent.
The graph does not represent a proportional relationship.
D)
The graph represents a proportional relationship because (0,0) is included.
E)
The graph represents a proportional relationship because x-values and y-
values are constantly increasing.

Answers: 3
Other questions on the subject: Mathematics
Mathematics, 21.06.2019 18:00, purplefish53
Jose predicted that he would sell 48 umbrellas. he actually sold 72 umbrellas. what are the values of a and b in the table below? round to the nearest tenth if necessary
Answers: 2
Mathematics, 21.06.2019 19:30, youcandoit13
Click the arrows to advance or review slides. mapping carbohydrates to food carbohydrates (grams) 15 food (quantity) bread (1 slice) pasta (1/3 cup) apple (1 medium) mashed potatoes (1/2 cup) broccoli (1/2 cup) carrots (1/2 cup) milk (1 cup) yogurt (6 oz.) 12 12 is jennifer's relation a function? yes no f 1 of 2 → jennifer figure out the difference between a function and a relation by answering the questions about her food choices
Answers: 2
Mathematics, 21.06.2019 21:20, madisontrosclair2
Amajor grocery store chain is trying to cut down on waste. currently, they get peaches from two different distributors, whole fruits and green grocer. out of a two large shipments, the manager randomly selects items from both suppliers and counts the number of items that are not sell-able due to bruising, disease or other problems. she then makes a confidence interval. is there a significant difference in the quality of the peaches between the two distributors? 95% ci for pw-pg: (0.064, 0.156)
Answers: 3
Do you know the correct answer?
Using the data shown on the graph, which statements are correct?
у
The constant ratio of
The constant ratio of
Questions in other subjects:
Mathematics, 20.08.2020 01:01
Mathematics, 20.08.2020 01:01

Mathematics, 20.08.2020 01:01

Arts, 20.08.2020 01:01


