

Mathematics, 10.04.2021 05:40, jack487
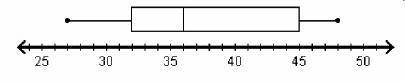
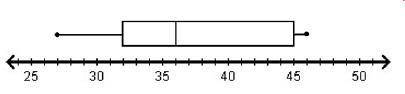
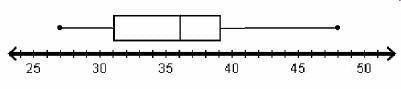
Which box plot correctly displays the data set with a maximum of 48, a minimum of 27, a median of 36, an upper quartile of 45, and a lower quartile of 32? (please refer to the answer like this: Image [number])


Answers: 2


Other questions on the subject: Mathematics
Mathematics, 21.06.2019 18:00, santosv3136
What are the equivalent ratios for 24/2= /3= /5.5=108/ = /15
Answers: 1
Mathematics, 21.06.2019 19:00, michellectucker1982
What is the explicit formula for this sequence? -7, -4, -1, 2, a.) an = 8 + (b - 1)3 b.) an = -7 + (n - 1)3 c.) an = 3 + (n -1) (-7) d.) an = -7 + (n - )
Answers: 1
Mathematics, 21.06.2019 19:40, ashley24109
The weights of broilers (commercially raised chickens) are approximately normally distributed with mean 1387 grams and standard deviation 161 grams. what is the probability that a randomly selected broiler weighs more than 1,425 grams?
Answers: 2
Do you know the correct answer?
Which box plot correctly displays the data set with a maximum of 48, a minimum of 27, a median of 36...
Questions in other subjects:

History, 16.12.2021 06:30
Mathematics, 16.12.2021 06:30

Biology, 16.12.2021 06:30
Mathematics, 16.12.2021 06:30

Biology, 16.12.2021 06:30


Health, 16.12.2021 06:30


