

Mathematics, 09.04.2021 23:20, Geo777
The two dot plots below compare the forearm lengths of two groups of schoolchildren:
Based on visual inspection of the dot plots, which group appears to have the longer average forearm length?
1)
Group A, because seven children have a forearm length longer than 10 inches
2)
Group B, because two children have a forearm length longer than 10 inches
3)
Group A, because one child in the group has the least forearm length of 9 inches
4)
Group B, because three children in the group have the least forearm length of 9 inches
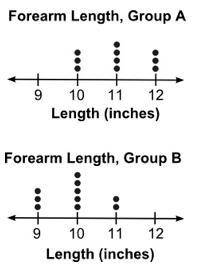

Answers: 1


Other questions on the subject: Mathematics
Mathematics, 21.06.2019 13:30, sarahsteelman
Rose drew a regression line for this paired data set. her line passed through (1, 2) and (3, 5) . what is the equation of rose's regression line?
Answers: 1
Mathematics, 21.06.2019 18:30, gabrielaaaa1323
At the olympic games, many events have several rounds of competition. one of these events is the men's 100-meter backstroke. the upper dot plot shows the times (in seconds) of the top 8 finishers in the final round of the 2012 olympics. the lower dot plot shows the times of the same 8 swimmers, but in the semifinal round. which pieces of information can be gathered from these dot plots? (remember that lower swim times are faster.) choose all answers that apply: a: the swimmers had faster times on average in the final round. b: the times in the final round vary noticeably more than the times in the semifinal round. c: none of the above.
Answers: 2
Mathematics, 21.06.2019 20:10, kingdrew27
Acolony contains 1500 bacteria. the population increases at a rate of 115% each hour. if x represents the number of hours elapsed, which function represents the scenario? f(x) = 1500(1.15)" f(x) = 1500(115) f(x) = 1500(2.15) f(x) = 1500(215)
Answers: 3
Do you know the correct answer?
The two dot plots below compare the forearm lengths of two groups of schoolchildren:
Based on visua...
Questions in other subjects:

English, 14.01.2021 18:50
Mathematics, 14.01.2021 18:50
Mathematics, 14.01.2021 18:50


