

Mathematics, 09.04.2021 18:40, karyme12
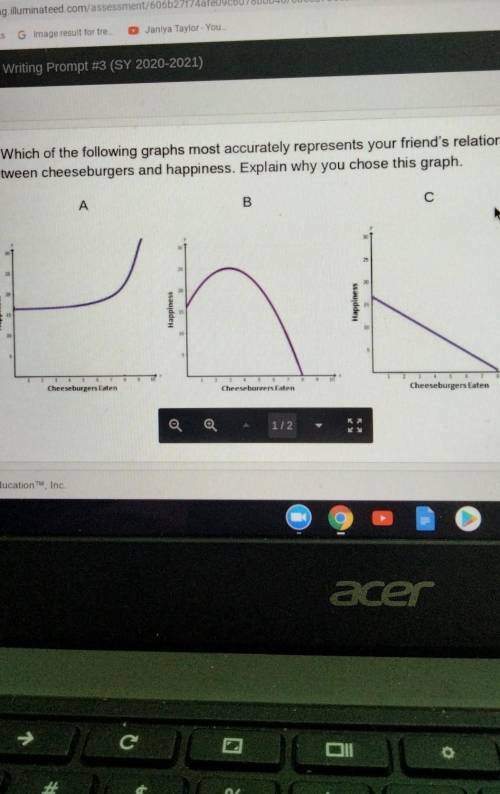
a) Which of the following graphs most accurately represents your friend's relationship between cheeseburgers and happiness. Explain why you chose this graph. A B с Happiness Happiness Happiness Cheeseburgers Eaten Cheeseburmers Eaten Cheeseburgers Eaten

Answers: 1


Other questions on the subject: Mathematics
Mathematics, 21.06.2019 16:00, floressavanna15
Choose the point slope form of the equation below that represents the like that passes through the points (-6,4) and (2, 0)
Answers: 1
Mathematics, 21.06.2019 21:30, bandzswagg123
Zack notices that segment nm and segment pq are congruent in the image below: which step could him determine if δnmo ≅δpqr by sas? (5 points) segment mo ≅ segment qr segment on ≅ segment qp ∠ n ≅ ∠ r ∠ o ≅ ∠ q
Answers: 3
Do you know the correct answer?
a) Which of the following graphs most accurately represents your friend's relationship between chees...
Questions in other subjects:

Mathematics, 15.07.2019 15:30
Mathematics, 15.07.2019 15:30


Physics, 15.07.2019 15:30
Mathematics, 15.07.2019 15:30

Chemistry, 15.07.2019 15:30


