

Mathematics, 09.04.2021 01:00, sarahidan
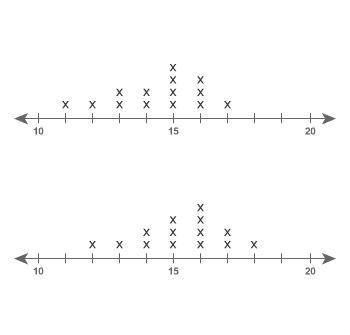
Dot plot 1 is the top plot. Dot plot 2 is the bottom plot.
According to the dot plots, which statement is true?
A. The mode of the data in dot plot 1 is less than the mode of the data in dot plot 2.
B. The median of the data in dot plot 1 is greater than the median of the data in dot plot 2.
C. The range of the data in dot plot 1 is less than the range of the data in dot plot 2.
D. The mean of the data in dot plot 1 is greater than the mean of the data in data plot 2.

Answers: 1


Other questions on the subject: Mathematics
Mathematics, 21.06.2019 20:00, whosdarrin9396
If cos(2x) = tan^2(y), show that cos(2y) = tan^2(x).
Answers: 3
Mathematics, 21.06.2019 22:00, ashuntihouston14
If the altitude is drawn to the hypotenuse of a right triangle, then the two triangles formed are similar to the original triangle and to each other. which set of triangles shows the similar triangles created by the altitude in the diagram?
Answers: 3
Mathematics, 21.06.2019 22:00, reesewaggoner8
Uestion 1(multiple choice worth 5 points) (05.02)alex wants to paint one side of his skateboard ramp with glow-in-the-dark paint, but he needs to know how much area he is painting. calculate the area of the isosceles trapezoid. isosceles trapezoid with top base 12 feet, bottom base of 18 feet, and height of 6 feet. 72 ft2 84 ft2 90 ft2 108 ft2
Answers: 1
Do you know the correct answer?
Dot plot 1 is the top plot. Dot plot 2 is the bottom plot.
According to the dot plots, which statem...
Questions in other subjects:
Mathematics, 13.02.2020 02:19
Mathematics, 13.02.2020 02:19


History, 13.02.2020 02:19

English, 13.02.2020 02:19
Social Studies, 13.02.2020 02:19


