
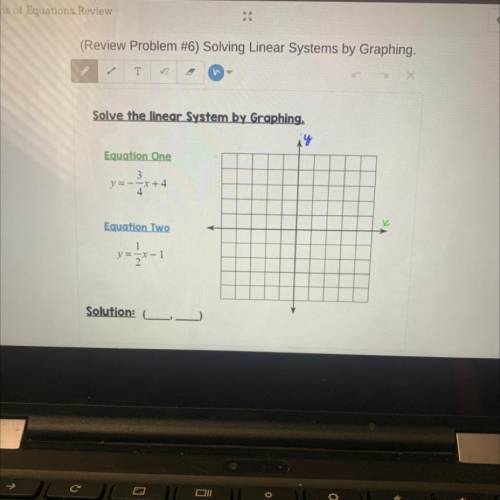


Solving linear systems by graphing
...

Answers: 2
Other questions on the subject: Mathematics

Mathematics, 21.06.2019 18:10, normahernandez977
Find the solution set of this inequality. enter your answer in interval notation using grouping symbols. |8x-4| ≤ 12
Answers: 1
Mathematics, 22.06.2019 02:00, jadajones5313
The resumâ´es of two male applicants for a college teaching position in chemistry are placed in the same file as the resumâ´es of two female applicants. two positions become available, and the first, at the rank of assistant professor, is filled by selecting one of the four applicants at random. the second position, at the rank of instructor, is then filled by selecting at random one of the remaining three applicants. using the notation m2f1, for example, to denote the simple event that the first position is filled by the second male applicant and the second position is then filled by the first female applicant, (a) list the elements of a sample space s; (b) list the elements of s corresponding to event a that the position of assistant professor is filled by a male applicant; (c) list the elements of s corresponding to event b that exactly one of the two positions is filled by a male applicant; (d) list the elements of s corresponding to event c that neither position is filled by a male applicant; (e) list the elements of s corresponding to the event a â© b; (f) list the elements of s corresponding to the event a âş c; (g) construct a venn diagram to illustrate the intersections and unions of the events a, b, and c.
Answers: 3
Mathematics, 22.06.2019 03:50, aliyahgregory
Amovie producer conducted a survey after the screening of his movie to find out how the film would be received by viewers from different age groups. the columns in the two-way table indicate the numbers of viewers who rated the film on a four-point scale: excellent, good, average, and poor. viewer's age group excellent good average poor marginal totals 16-25 52 42 12 7 113 26-35 33 50 5 9 97 36-45 58 12 28 34 132 which of these observations is supported by the data in the table? note: a rating of good or excellent means the audience liked the movie, while a rating of poor means the audience disliked the movie. a. the majority of the audience in the 26-35 age group disliked the movie. b. among those who liked the movie, the majority were in the oldest age group. c. among those who disliked the movie, the majority were in the 26-35 age group. d. the majority of the audience in the 16-25 age group liked the movie. e. the majority of the audience from all the age groups disliked the movie
Answers: 3
Mathematics, 22.06.2019 06:30, laurenlol756
The equation y equals 11 x represents the calories jake burns when cross country skiing, where x is time in minutes and why is the number of calories. the graph shows the calories he burns while playing basketball which activity burns at a faster rate? explain
Answers: 2
Do you know the correct answer?
Questions in other subjects:


Social Studies, 30.06.2021 03:40


Social Studies, 30.06.2021 03:40


