


A) skewed to the left

Mathematics, 08.04.2021 21:30, ladnerhailey16
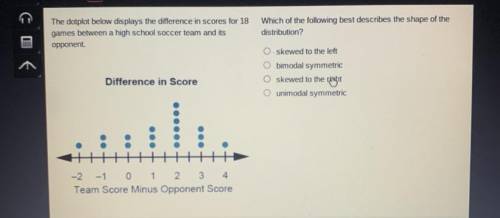
Which of the following best describes the shape of the
distribution?
A) skewed to the left
B) bimodal symmetric
C) skewed to the right
D) unimodal symmetric

Answers: 1
Other questions on the subject: Mathematics
Mathematics, 21.06.2019 14:30, ultimateapes
Use the radius you found in part i (r=26.8 cm) with the surface area formula below to find the surface area of the sphere. show your work and round your answer to the nearest tenth. the surface area of a sphere: sa = 4πr^2 self note: 3.8.4
Answers: 2
Mathematics, 21.06.2019 17:00, trosclairozlynn02
Tom had a total of $220 and he spent $35 on a basketball ticket . what percent of his money did he have left?
Answers: 1
Mathematics, 21.06.2019 21:00, VictoriaRose520
Evaluate this using ! 0.25^2 x 2.4 + 0.25 x 2.4^2 − 0.25 x 2.4 x 0.65
Answers: 1
Mathematics, 22.06.2019 02:30, misk980
Atrain traveled for 1.5 hours to the first station, stopped for 30 minutes, then traveled for 4 hours to the final station where it stopped for 1 hour. the total distance traveled is a function of time. which graph most accurately represents this scenario? a graph is shown with the x-axis labeled time (in hours) and the y-axis labeled total distance (in miles). the line begins at the origin and moves upward for 1.5 hours. the line then continues upward at a slow rate until 2 hours. from 2 to 6 hours, the line continues quickly upward. from 6 to 7 hours, it moves downward until it touches the x-axis a graph is shown with the axis labeled time (in hours) and the y axis labeled total distance (in miles). a line is shown beginning at the origin. the line moves upward until 1.5 hours, then is a horizontal line until 2 hours. the line moves quickly upward again until 6 hours, and then is horizontal until 7 hours a graph is shown with the axis labeled time (in hours) and the y-axis labeled total distance (in miles). the line begins at the y-axis where y equals 125. it is horizontal until 1.5 hours, then moves downward until 2 hours where it touches the x-axis. the line moves upward until 6 hours and then moves downward until 7 hours where it touches the x-axis a graph is shown with the axis labeled time (in hours) and the y-axis labeled total distance (in miles). the line begins at y equals 125 and is horizontal for 1.5 hours. the line moves downward until 2 hours, then back up until 5.5 hours. the line is horizontal from 5.5 to 7 hours
Answers: 1
Do you know the correct answer?
Which of the following best describes the shape of the
distribution?
A) skewed to the left
A) skewed to the left
Questions in other subjects:

Mathematics, 04.09.2020 18:01
English, 04.09.2020 18:01

Health, 04.09.2020 18:01


