


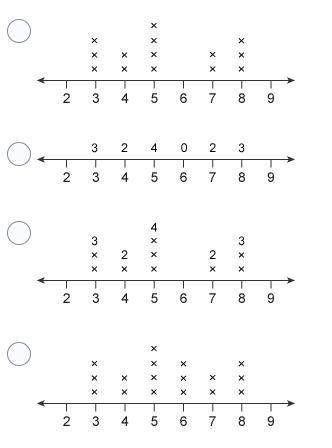
Which dot plot represents the data in this frequency table?
Number 3 4 5 7 8
Frequency 3 2 4...

Mathematics, 07.04.2021 22:30, sarahcyberpony
Which dot plot represents the data in this frequency table?
Number 3 4 5 7 8
Frequency 3 2 4 2 3

Answers: 2
Other questions on the subject: Mathematics
Mathematics, 21.06.2019 17:00, softball2895
The center of a circle represent by the equation (x+9)^2+(y-6)^2=10^2 (-9,6), (-6,9), (6,-9) ,(9,-6)
Answers: 1
Mathematics, 21.06.2019 19:30, Lindsay882
How long must $542 be invested at a rate of 7% to earn $303.52 in interest? in a easier way
Answers: 1
Do you know the correct answer?
Questions in other subjects:


