

Mathematics, 07.04.2021 19:30, elijaahstepp041
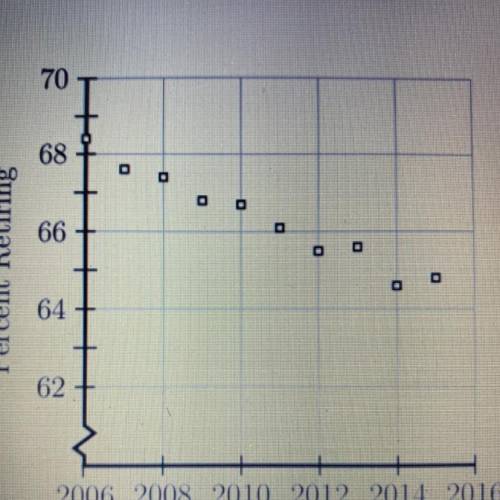
The scatterplot shown below represent data for each of the years from 2006 to 2015. The plot shows the percent of people 62 years of age and older who were working and then retired during each of those years. If this trend continued, which if the following beat predicts the percent who retired in 2016?
A: 62%
B: 64%
C: 66%
D: 68%

Answers: 1


Other questions on the subject: Mathematics
Mathematics, 21.06.2019 20:10, thekid3176
Which value of m will create a system of parallel lines with no solution? y= mx - 6 8x - 4y = 12
Answers: 1
Mathematics, 21.06.2019 21:00, gujacksongu6
M. xyz =radians. covert this radian measure to its equivalent measure in degrees.
Answers: 1
Mathematics, 21.06.2019 21:20, KennyMckormic
The radius of the circle below intersects the unit circle at (3/5,4/5). what is the approximate value of theta? 0.6 radians 1.0 radians 36.9 degrees 53.1 degrees
Answers: 3
Do you know the correct answer?
The scatterplot shown below represent data for each of the years from 2006 to 2015. The plot shows t...
Questions in other subjects:

Business, 21.07.2019 03:30


History, 21.07.2019 03:30

Mathematics, 21.07.2019 03:30


