

Mathematics, 07.04.2021 01:40, rcfarlo9342
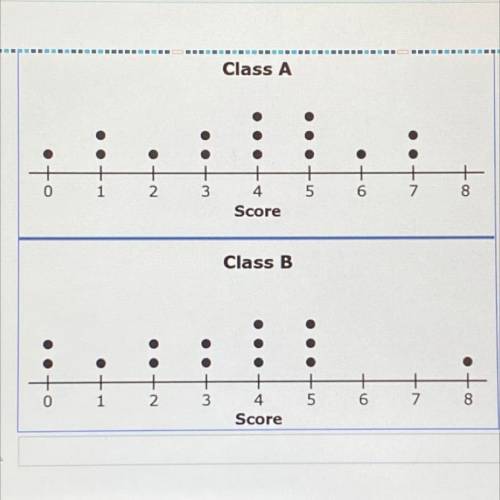
Each student is asked eight
questions and is scored on the number of correct answers. The teachers create a dot plot of the scores from 15 students from Class A and 14 students from Class B, as shown.
Another score is added to the plot for Class B to make the median of the two data sets equal.
Click on the dot plot to show
where this score could have been added.
The question is basically asking you to put a dot on top of one of the numbers in Class B where it belongs.

Answers: 2


Other questions on the subject: Mathematics
Mathematics, 21.06.2019 15:50, AaronMicrosoft15
If you shift the linear parent function, f(x)=x, up 13 units, what is the equation of the new function?
Answers: 1
Mathematics, 21.06.2019 16:00, ericavasquez824
The graph shows the distance y, in inches, a pendulum moves to the right (positive displacement) and to the left (negative displacement), for a given number of seconds x. how many seconds are required for the pendulum to move from its resting position and return? enter your answer in the box.
Answers: 2
Do you know the correct answer?
Each student is asked eight
questions and is scored on the number of correct answers. The teachers...
Questions in other subjects:

History, 05.10.2021 14:10

English, 05.10.2021 14:10
English, 05.10.2021 14:10
Mathematics, 05.10.2021 14:10
History, 05.10.2021 14:10


