

Mathematics, 06.04.2021 23:40, Thevilqueen2857
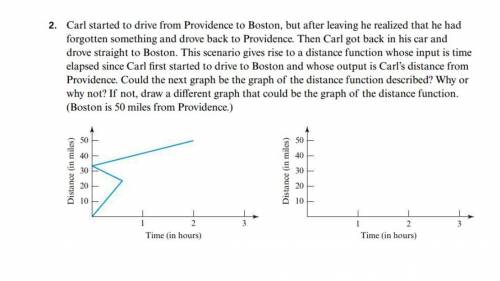
I managed to draw the graph, but I have a hard time explaining "could the next graph be the graph of the distance function described?"

Answers: 1


Other questions on the subject: Mathematics
Mathematics, 21.06.2019 19:00, breannaasmith1122
Which of the expressions (on the photo document i inserted) together represent all solutions to the following equation? 8cos(12x)+4=-4 *the answer should be in degrees.* > i would like for someone to explain the process to find the solutions for this.
Answers: 2
Mathematics, 21.06.2019 19:20, TrudnEli1217
Which number completes the system of linear inequalities represented by the graph? y> 2x – 2 and x + 4y 2 et 2 3 4
Answers: 3
Mathematics, 21.06.2019 21:40, EvoBruh3273
Drag the tiles to the correct boxes to complete the pairs. using the properties of integer exponents, match each expression with the correct equivalent expression.
Answers: 1
Mathematics, 21.06.2019 22:00, hannahpalmario
The customer price index(cpi), which measures the cost of a typical package of customer goods, was 208.8 in 2011 and 244.1 in 2016.let x=11 corresponding to the year 2011 an estimate to cpi into 2013 and 2014. assume that the data can be modeled by a straight line and the trend to continue idenfinitely. use data points to find such a line and then estimate the requested quantities
Answers: 1
Do you know the correct answer?
I managed to draw the graph, but I have a hard time explaining "could the next graph be the graph of...
Questions in other subjects:


Biology, 30.07.2019 16:00


History, 30.07.2019 16:00

Mathematics, 30.07.2019 16:00


