

Mathematics, 06.04.2021 22:20, jay0630
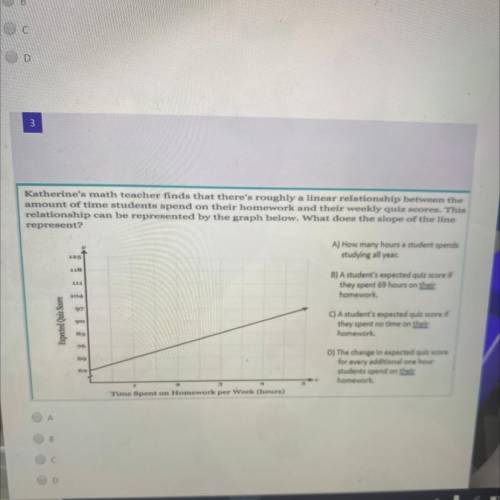
Katherine's math teacher finds that there's roughly a linear relationship between the
amount of time students spend on their homework and their weekly quiz scores. This
relationship can be represented by the graph below. What does the slope of the line
represent?
A) How many hours a student spends
studying all year.
B) A student's expected quiz score if
they spent 69 hours on their
homework.
195
118
111
104
07
Expected Quiz Score
90
C) A student's expected quiz score if
they spent no time on their
homework.
83
76
69
D) The change in expected quiz score
for every additional one hour
students spend on their
homework.
63
Time Spent on Homework per week (hours)

Answers: 3


Other questions on the subject: Mathematics
Mathematics, 21.06.2019 17:40, kazmiere2005oye9tz
Afamily of five rents a kayak and splits the total time, k, equally. each family member spent less than 25 minutes kayaking. which values can be used to complete the math sentence below so that it accurately represents the situation? intro done
Answers: 2
Do you know the correct answer?
Katherine's math teacher finds that there's roughly a linear relationship between the
amount of tim...
Questions in other subjects:

Chemistry, 08.02.2021 22:30


Mathematics, 08.02.2021 22:30

English, 08.02.2021 22:30

Social Studies, 08.02.2021 22:30


