


6-2: Students can describe and graph exponential functions.
4 3 2 1 NE
9) Consider the expone...

Mathematics, 06.04.2021 21:00, 24lbriscoe
6-2: Students can describe and graph exponential functions.
4 3 2 1 NE
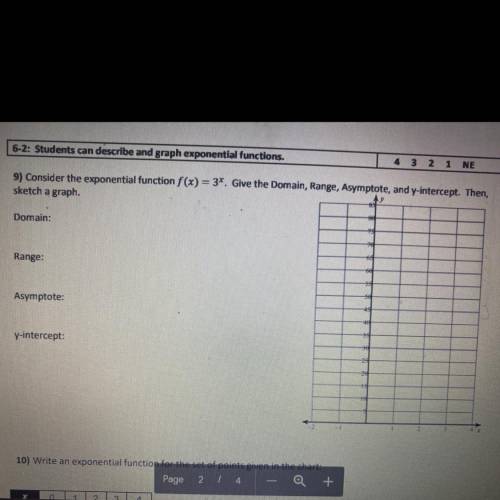
9) Consider the exponential function f(x) = 3*. Give the Domain, Range, Asymptote, and y-intercept. Then,
sketch a graph.
Domain:
Range:
Asymptote:
y-intercept:
had to ed

Answers: 3
Other questions on the subject: Mathematics
Mathematics, 20.06.2019 18:04, amauris77748
Simplify. show your work. ( 6x-2 ) ^2 ( 0.5x )^4
Answers: 1
Mathematics, 21.06.2019 18:00, evarod
The given dot plot represents the average daily temperatures, in degrees fahrenheit, recorded in a town during the first 15 days of september. if the dot plot is converted to a box plot, the first quartile would be drawn at __ , and the third quartile would be drawn at link to the chart is here
Answers: 1
Mathematics, 21.06.2019 18:00, nefertitihorne12
Me asap! what is the slope of this line? enter your answer in the box.
Answers: 2
Mathematics, 21.06.2019 18:10, ltuthill
Jordan has $5.37, which he is using to buy ingredients to make salsa. he is buying one red pepper for $1.29 and three pounds of tomatoes. if jordan has exactly the right amount of money he needs, what is the price per pound of the tomatoes? choose the correct equation to represent this real-world problem. solve the equation and verify the reasonableness of your answer. a pound of tomatoes costs .
Answers: 1
Do you know the correct answer?
Questions in other subjects:

History, 07.09.2019 01:30


History, 07.09.2019 01:30

Mathematics, 07.09.2019 01:30


