Mathematics, 05.04.2021 22:10, tsvijay121
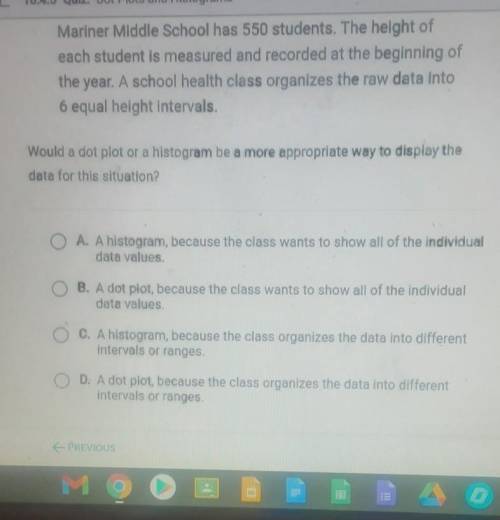
Would a dot plot or a histogram be a more appropriate way to display the data for this situation? O A. A histogram, because the class wants to show all of the individual data values. O B. A dot plot, because the class wants to show all of the individual data values. C. A histogram, because the class organizes the data into different Intervals or ranges. D. A dot plot, because the class organizes the data into different intervals or ranges.


Answers: 2
Other questions on the subject: Mathematics


Mathematics, 21.06.2019 22:00, blythephillips2734
Benjamin is making bow ties. how many 1/2yards lomg bow ties can he make if he has 18 feet of fabric?
Answers: 2

Do you know the correct answer?
Would a dot plot or a histogram be a more appropriate way to display the data for this situation? O...
Questions in other subjects:

Mathematics, 12.07.2021 22:00


Mathematics, 12.07.2021 22:00


Mathematics, 12.07.2021 22:00

Mathematics, 12.07.2021 22:00


