


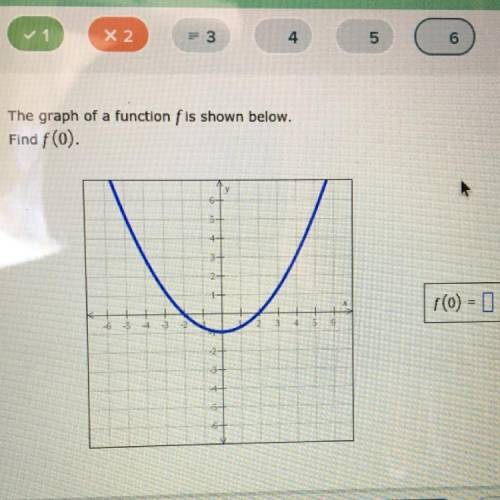
The graph of a function f is shown below.
Find f(0).
...

Mathematics, 03.04.2021 01:00, christianconklin22
The graph of a function f is shown below.
Find f(0).

Answers: 1
Other questions on the subject: Mathematics
Mathematics, 21.06.2019 20:10, morgantisch25
A. use the formula for continuous compounding with the original example: $1000 invested at 2% for 1 year. record the amount to 5 decimal places. use a calculator. b. compare it to the result using the original compound interest formula with n = 365 calculated to 5 decimal places. which has a larger value? explain.
Answers: 1
Do you know the correct answer?
Questions in other subjects:


History, 18.09.2021 21:10
History, 18.09.2021 21:10
Mathematics, 18.09.2021 21:10


Chemistry, 18.09.2021 21:10


