


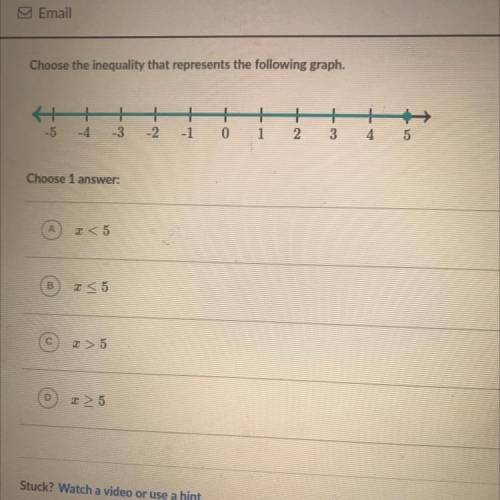
(ASPA JUST LOOK AT THE PICTURE)Choose the inequality that represents the following graph.
+
-...

Mathematics, 01.04.2021 21:30, skyemichellec
(ASPA JUST LOOK AT THE PICTURE)Choose the inequality that represents the following graph.
+
-3
1
-1 0 1
+ + 1
2 3 4
-5 -4
-2
5
Choose 1
A
B
o
D
25

Answers: 2
Other questions on the subject: Mathematics
Mathematics, 22.06.2019 03:00, Delgadojacky0206
L2.8.2 test (cst): triangles in the figure, pq is parallel to rs. the length of rp is 5 cm; the length of pt is 30 cm; the length of q7 is 60 cm. what is the length of so? o a. 20 cm 0 0 o b. 6 cm o c. 10 cm od. 2 cm 0 previous
Answers: 2
Mathematics, 22.06.2019 06:30, chelsea1524
Select the margin of error that corresponds to the sample mean that corresponds to each population: a population mean of 0.45, a standard deviation of 0.001, and margin of error of 0.5% a)0.44 b)0.46 c)0.45
Answers: 2
Mathematics, 22.06.2019 08:30, alyssatamayo641
If a flowering tree is cared for properly, the number of blossoms produced on the tree will exponentially increase until the tree reaches maturity. which graph could show y, the number of blossoms expected on a flowering tree, for each year after the young tree is planted, x?
Answers: 2
Do you know the correct answer?
Questions in other subjects:

Mathematics, 02.04.2020 23:09

History, 02.04.2020 23:09

Mathematics, 02.04.2020 23:10


