


30 points Please help
(06.01 MC)
The scatter plot shows the relationship between the test sco...

Mathematics, 31.03.2021 20:20, shartiarahoward
30 points Please help
(06.01 MC)
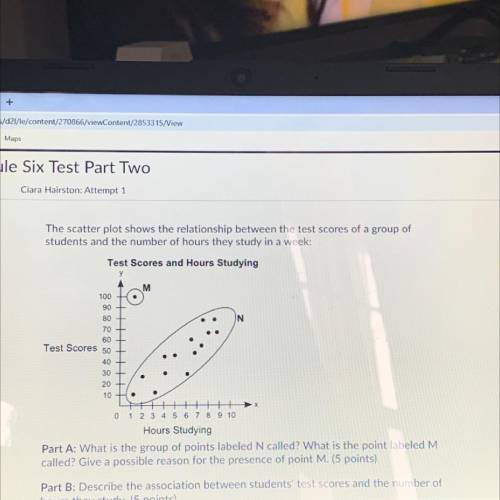
The scatter plot shows the relationship between the test scores of a group of
students and the number of hours they study in a week:
PART A: What is the group of points labeled N called? What is the point labeled M called? Give a possible reason for the presence of point M.
PART B: Describe the association between students test scores and the number of hours they study.

Answers: 2
Other questions on the subject: Mathematics
Mathematics, 21.06.2019 20:00, claudia3776
What does the sign of the slope tell you about a line?
Answers: 2
Mathematics, 21.06.2019 20:40, mimithurmond03
In each of the cases that follow, the magnitude of a vector is given along with the counterclockwise angle it makes with the +x axis. use trigonometry to find the x and y components of the vector. also, sketch each vector approximately to scale to see if your calculated answers seem reasonable. (a) 50.0 n at 60.0°, (b) 75 m/ s at 5π/ 6 rad, (c) 254 lb at 325°, (d) 69 km at 1.1π rad.
Answers: 3
Mathematics, 21.06.2019 22:00, kkeith121p6ujlt
5. (03.02)if g(x) = x2 + 3, find g(4). (2 points)1619811
Answers: 1
Do you know the correct answer?
Questions in other subjects:

Mathematics, 07.01.2021 03:50

Mathematics, 07.01.2021 03:50
Mathematics, 07.01.2021 03:50
Mathematics, 07.01.2021 03:50
Mathematics, 07.01.2021 03:50
Mathematics, 07.01.2021 03:50

Law, 07.01.2021 03:50


