

Mathematics, 31.03.2021 19:00, 200002977
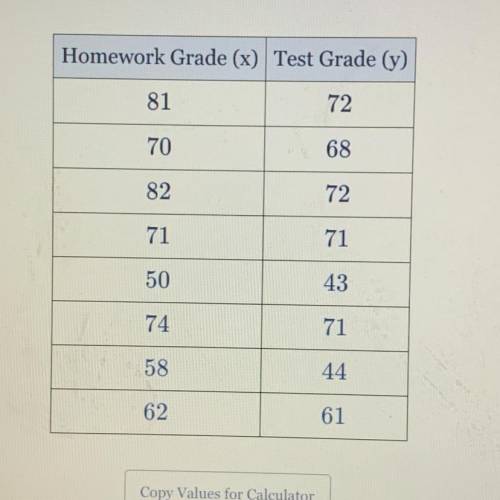
A mathematics teacher wanted to see the correlation between test scores and
homework. The homework grade (x) and test grade (y) are given in the accompanying
table. Write the linear regression equation that represents this set of data, rounding
all coefficients to the nearest hundredth. Using this equation, find the projected test
grade, to the nearest integer, for a student with a homework grade of 77.

Answers: 3


Other questions on the subject: Mathematics
Mathematics, 21.06.2019 19:30, shanua
Needmax recorded the heights of 500 male humans. he found that the heights were normally distributed around a mean of 177 centimeters. which statements about max’s data must be true? a) the median of max’s data is 250 b) more than half of the data points max recorded were 177 centimeters. c) a data point chosen at random is as likely to be above the mean as it is to be below the mean. d) every height within three standard deviations of the mean is equally likely to be chosen if a data point is selected at random.
Answers: 2
Mathematics, 21.06.2019 22:50, kristofwr3444
Use the quadratic function to predict f(x) if x equals 8. f(x) = 25x2 − 28x + 585
Answers: 1
Do you know the correct answer?
A mathematics teacher wanted to see the correlation between test scores and
homework. The homework...
Questions in other subjects:

Physics, 13.12.2020 19:00


World Languages, 13.12.2020 19:00
Mathematics, 13.12.2020 19:00

Mathematics, 13.12.2020 19:10
Mathematics, 13.12.2020 19:10
English, 13.12.2020 19:10


