


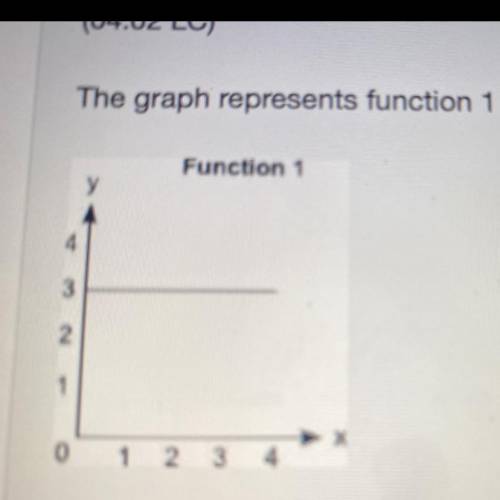
The graph represents function 1 and the equation represents function 2:
Function 1
See image...

Mathematics, 31.03.2021 16:50, Savageboyn
The graph represents function 1 and the equation represents function 2:
Function 1
See image below for function 1
Function 2
y = 2x + 1
How much more is the rate of change of function 2 than the rate of change of function 1?
1
2
3
4

Answers: 1
Other questions on the subject: Mathematics
Mathematics, 21.06.2019 15:30, MidnightYT
Find the slope of the line below . enter your answer as a fraction or decimal. use a slash mark ( / ) as the fraction bar if necessary
Answers: 1
Mathematics, 21.06.2019 18:00, kcameronanderso
Liz is shipping a package to her friend. the maximum weight of a medium flat-rate box is 20 pounds, including the box which weighs 6 ounces. write and solve an inequality to describe the possible weight ,w, of the contents that liz will ship to her friend if she must use a medium flat-rate box.
Answers: 2
Do you know the correct answer?
Questions in other subjects:

History, 25.01.2022 08:40
Mathematics, 25.01.2022 08:40

Arts, 25.01.2022 08:40


